
Are you looking for simple and interactive maps in JavaScript for your business’s web app? Well, this article has everything for you. Nowadays, adding JS maps to our applications can make them highly useful. A JavaScript interactive map helps to make an application user-friendly. But adding maps to an app is a little complicated process.
We can add interactive maps to our web application with some amazing JavaScript libraries. JS maps help our customers to find our business and hence help us promote business. We can use a wide range of JavaScript libraries to create customized maps. But which JavaScript library has maximum customization options? All of this is explained in this article.

Please continue reading!
Table of Contents
What Is JavaScript Interactive Map?
JavaScript interactive map helps us to find useful information through a collection of elements. We call them JavaScript interactive maps because we use a JavaScript mapping library to develop these maps. The elements in interactive maps either hold a key or a value. Let’s explore the purpose of JavaScript interactive maps.
There exists an API that is based on leaflet JS and is known as Interactive maps JavaScript API. This API helps us customize maps’ appearance in our web or mobile application. Note that such maps make our application mobile friendly.

What Is The Purpose Of Javascript Interactive Map?
The JavaScript interactive maps help us customize our maps using images and texts. We can display vector data, markers, and map tiles loaded from our specific source or any web page. There is a Maps JavaScript API that allows us to create maps in four different categories. These are:
- Terrain
- Hybrid
- Roadmap
- Satellite
The best part to know about Maps JavaScript API is that it localizes text into our maps using more than 40 languages. We can also customize the UI controls appearing on our maps. Other than that, there are multiple customization options available. Let’s explore the top 7 tools to create a map.

Top 7 Tools To Create JavaScript Interactive Map
Here we will explain the seven best JavaScript tools to build highly personalized and dynamic maps. Although we can have some alternative tools for map building, we are focusing on JavaScript libraries. This is because we want to display unique maps with customizable options for the app. Let’s begin our journey.
FusionCharts
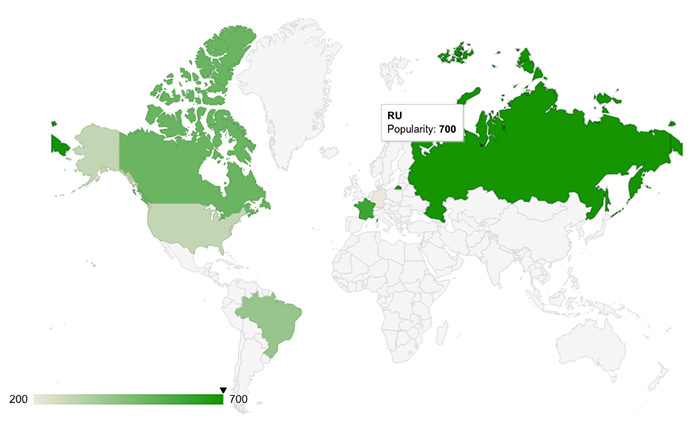
FusionCharts help us to create highly interactive and data-driven maps using JavaScript. The consistent API, extensive documentation, and cross-browser support make it easier to achieve high-quality maps. As a matter of fact, FusionCharts offer more than 2000 maps. Therefore, getting a map with particular requirements and features becomes easy.
The geographical maps at FusionCharts include all countries to plot business data. Some examples are employment level by office locations & state and mapping revenue in any region.
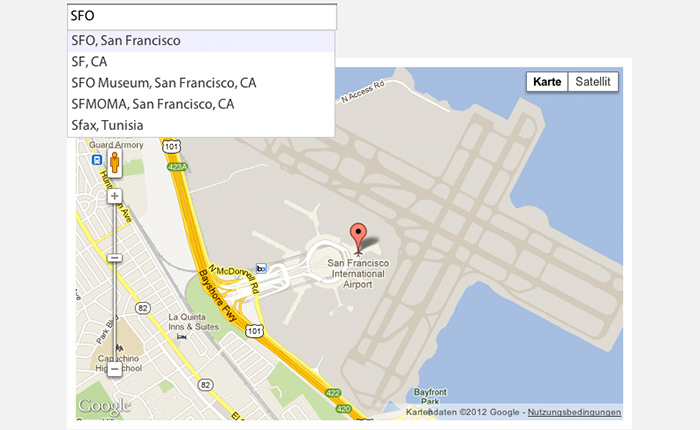
Geocomplete
A JavaScript library that is distinct on its own adds an input field along with our map. Geocomplete can show us suggestions for countries, cities, and states as we type there. The map data source for this JS library is Google maps, while the dependencies include jQuery. Geocomplete owns MIT License.
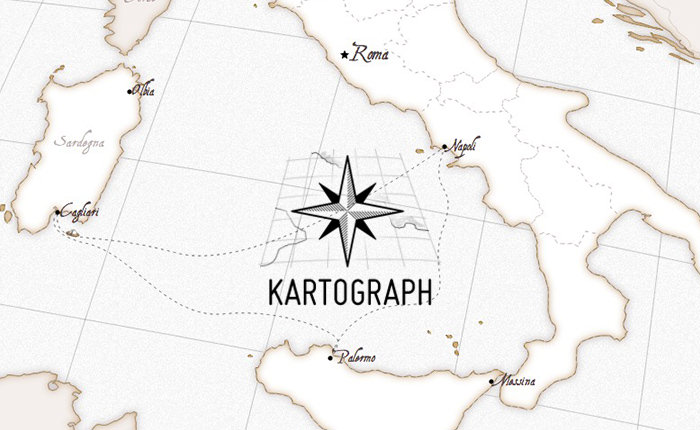
Kartograph
This lightweight JavaScript library uses Kartograph SVG maps that help to offer mapping services. It is built on top of Raphael and jQuery and uses the Karto.py utility to generate amazing maps.
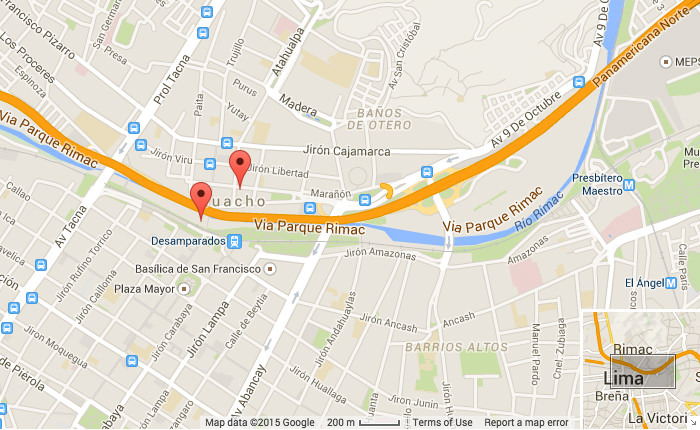
GMaps
It helps us to customize and add Google maps as a breeze. It also gives us polylines for drawing routes, HTML elements, and even special menu controls. It has no dependencies with the MIT license and map data source as Google maps.
jHere
With an amazing size of 5KB, jHere helps to build highly customizable and interactive maps. Its map data source is HERE maps with dependencies jQuery or Zepto.js. It also works with an MIT license.

Mapael
jQuery Mapael allows us to create elegant data visualization through interactive maps. We designate different regions using different colors in Mapael. Built with SEO, it has data source Rapheal.JS and dependencies such as jQuery.
D3.js
It is a comprehensive JS library that uses CSS, SVG, and HTML. It uses the map data source D3.js. Moreover, it has no dependencies and an undefined license.
GeoChart
This Google map renders text, markers, and regions instead of tiny details like a full-fledged map. It generates an SVG map with multiple customization options. GeoChart has licensed Google Maps TOS with map data source as Google maps.
Top 7 Interactive Map JavaScript Libraries
The importance of maps for online applications is increasing with time. When we develop maps for our apps, they should be clear. But creating interactive, lightweight, and mobile-friendly interactive maps is also a challenge. Let’s explore the top 7 interactive maps JavaScript libraries.
JavaScript Interactive Map: Jsvectormap
It is a lightweight JS library that helps us to create maps with pretty data visualization.
Leaflet
A leading and open source JavaScript library with all features we expect in a mapping library. Etsy, Facebook, Flicker, and Github also support Leaflet.
Mapbox Gl Js
Mapbox GI JS helps us to create customizable vector maps. It is one of the most advanced mapping solutions. We report live data and integrate Mapbox directly into our apps.
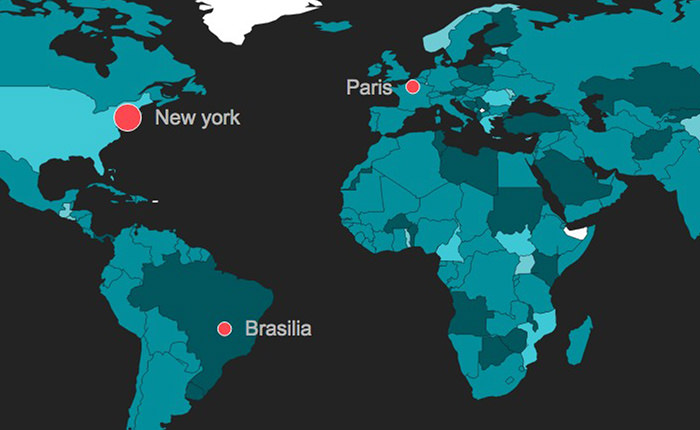
Datamaps
With pretty diverse flexibility, Datamaps can work on small and large screen sizes. Moreover, It also gives us higher resolutions. We can add bubbles, play with different colors and make an orthographic projection. Everything is possible using Datamaps.
Openlayers
It is a mobile-ready and fast web mapping solution. Features like canvas integration and 2D rendering have made it popular for years. Openlayers also allows us to pull tiles from applications like Mapbox and bing.
Polymaps
Polymaps is known for its advanced browser technology that uses SVG to create stunning maps. Moreover, It is a perfect solution if we want an image-based map.
Fantasy Map Generator
Fantasy map generator also helps us to create highly customizable and interactive maps. It is recently updated to a new version with features like 14 new default fonts.
Start Exploring More About Maps With FusionCharts!
FusionCharts is an amazing platform to help us make maps for our online web application. The best part to know is that we can integrate more than 2000 maps easily. Moreover, FusionCharts has gained the trust of more than 800,000 developers across 28,000 countries.
We get powerful charts or maps for large data visualization. The large number of geographical maps at FusionCharts can help us to visualize data for different purposes.

JavaScript Interactive Map: Conclusion
Maps are gaining importance at a large scale, especially when we want to promote our business. Therefore, creating an interactive map is important for a large customer base. We can easily create maps with JavaScript charting library. The above-mentioned JS libraries are reliable enough to use for our web application.
JavaScript Interactive Map: FAQs
Can I Create an Interactive Map?
Yes. Creating an interactive map is easy when using JS mapping libraries. You can also create map in Excel.
Is Mapbox Better Than Leaflet?
It depends on the features we require for our map, but Mapbox gives more opportunities than Leaflet.
What Is Interactive Map Tool?
An interactive allows us to zoom in, zoom out, and check useful information by panning around.
Is Mapbox Free?
Mapbox is not entirely free. It has some pricing plans for premium features.
Download FusionCharts Suite XT for free now to integrate highly-customizable maps into your app.