Building a useful data visualization usually involves several steps:
- Preparing the data
- Choosing the right chart type
- Configuring its appearance
- Writing the code needed to bring everything together
The new FusionDev AI chart generator makes that workflow more conversational. Instead of writing code and starting with chart configuration, you can describe what you want to visualize, provide your data, and generate an interactive chart.
You can also refine it with follow-up instructions and move toward implementation with generated code.
It brings AI chart creation and FusionCharts development assistance together in one experience.
Table of Contents
What’s New in FusionDev AI?
FusionDev AI originally arrived with FusionCharts 4.0 as an AI-powered documentation and coding assistant. It helped developers find information, answered FusionCharts questions, and generated code.
The refreshed experience expands that workflow with more hands-on chart creation capabilities.
You can now use FusionDev AI to:
- Create charts from prompts: Describe the visualization you want using natural language.
- Visualize your data: Provide a dataset and ask FusionDev AI to turn it into an appropriate interactive chart.
- Customize charts conversationally: Use follow-up instructions to adjust colors, labels, titles, configurations, and other presentation details.
- Generate implementation code: Get code that you can use as a starting point when adding the visualization to your application.
- Get FusionCharts development help: Ask questions about configuration, documentation, or troubleshooting without manually searching through multiple documentation pages.
This creates a more continuous workflow from exploring an idea to seeing the visualization and working toward implementation.
See the AI Chart Generator in Action: From Prompt to Interactive Chart
Consider a simple sales dashboard showing monthly revenue against targets.
First, provide FusionDev AI with a dataset such as:
| Month | Revenue | Sales Target |
|---|---|---|
| January | $82,000 | $80,000 |
| February | $91,000 | $85,000 |
| March | $88,000 | $90,000 |
| April | $104,000 | $95,000 |
| May | $112,000 | $100,000 |
| June | $118,000 | $110,000 |
Then describe what you want:
Create an interactive column chart comparing monthly revenue against sales targets from January to June 2026. Use blue for revenue and orange for targets. Add tooltips, a legend, and the title “Monthly Sales Performance 2026”. Format values in USD and generate React implementation code.
FusionDev AI can use the instructions and data to help create the visualization without requiring you to manually configure every chart property from the beginning.

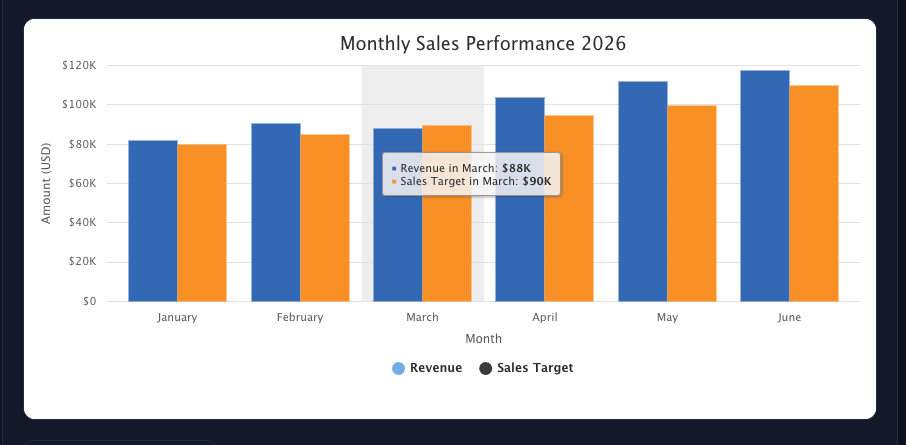
Once the chart is generated, you can continue the conversation.
For example, you might ask:
Change the revenue series to dark blue and move the legend to the right side of the chart.


This makes it easier to experiment with how a visualization should look in seconds without repeatedly editing configuration objects and spending hours just to test an idea.
When you’re ready to move from the prototype into your application, you can use the generated implementation code as a starting point. For a React project, for example, this can reduce the amount of initial chart configuration you need to write manually.
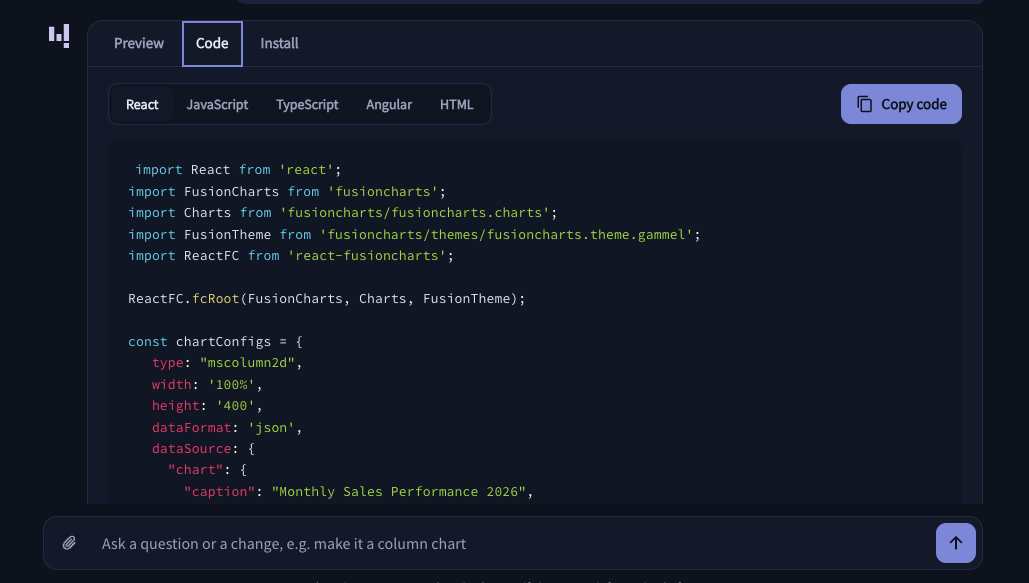

As with any AI-generated code, review the output, test the visualization, and verify its behavior before using it in production.
Why Developers Should Try the New FusionDev AI
The new experience is particularly useful during the early stages of visualization development.
Instead of manually configuring every option before you can evaluate an idea, you can describe the result you want and iterate from there. That can help you prototype visualizations faster, compare chart approaches, experiment with presentation options, and generate starter code for application development.
FusionDev AI also remains a FusionCharts development assistant. If you encounter a configuration question or need help understanding how a FusionCharts feature works, you can ask for guidance alongside your chart-building workflow.
It doesn’t replace reviewing documentation or testing your implementation. Instead, it gives developers another way to move between an idea, a visualization, and the code required to build it.
Start Building with FusionDev AI
Whether you’re creating your first FusionCharts visualization or working on a more complex dashboard, the new FusionDev AI experience gives you a more conversational way to explore visualization ideas.
Describe your data, generate a chart, refine the result, and use the generated code to help move your visualization into your application.
Try FusionDev AI and see what you can build.