Table of Contents
Introduction
All projects, big or small, have multiple data points that stakeholders need to see, such as timelines, expenses, efficiency, and so on. Gantt charts are a type of bar chart that depicts a project schedule. Gantt charts and project management are inextricably linked. Indeed, Henry Gantt, the creator (and namesake) of Gantt charts, is regarded as one of the forefathers of project management (along with Henri Fayol).
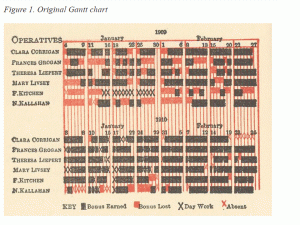
A Gantt chart is used to display timelines. It is a date/time chart that allows you to plot tasks with exact start and end dates/times. Milestones can also be used to specify how much of a project must be completed by when. In general, this chart appears to be an expanded version of the bar chart. The chart canvas is divided into two sections: the view pane and the data table. In the view pane, tasks are listed along with their start and end dates/times. The data table contains horizontal bars that represent tasks. The task’s duration is represented by the length of the bar. Tasks are connected with arrows, and milestones are represented by stars or polygons.
However, since the introduction of Gantt Charts more than a century ago, projects have evolved dramatically. While time is still an important consideration for project owners and managers, there are other considerations, particularly when it comes to building software projects or due to the affect of AI and workflow automation services that decreases timeframe to complete some task rapidly so due to evolving timelines project requirements for such tasks are more fluid than their traditional counterparts, such as construction, mining, or even manufacturing. As a result, Gantt charts are not always the best choice for communicating progress plans and progress to stakeholders.
In this article, we’ll tackle our in-house dataviz experts, who assisted us in determining when it is best to use a Gantt chart and when it is best to use another visualization. You may use the gantt data chart that is powered by Fusion Charts.
When is Using a Gantt Chart Not a Good Idea
When You Need to See the Amount of Work Done
Each bar on a Gantt chart indicates the time period over which a particular set of tasks will be completed. However, by looking at the bar for a particular set of tasks, you cannot tell what level of resources are required to achieve those tasks. So, a short bar might take 500 man-hours while a longer bar may only take 20 man-hours. The longer bar may indicate to the uninformed user that it is a bigger task, when in fact it is not.
When You Need a Simplistic View of Your Data
In a lot of larger-scale projects, there will be a large number of tasks undertaken and resources employed to complete the project. However, when the project gets to this level, it must be managed by a small number of people (perhaps one) who manages all of the details. Sometimes this does not work so well in a business that is not used to this type of management. Big businesses will frequently employ one or more project managers who are very skilled in this. For a range of reasons, this may not work so well in a smaller enterprise.
When You Haven’t Completed the Planning
The biggest limitation of a Gantt chart is that it relies upon the work breakdown structure to have already been constructed – and for it to be complete. Should there be major tasks missing from the WBS, or should a major milestone be missing, the Gantt chart will not showcase the same to you. In fact, if you are attempting to create the work breakdown structure at the same time you are constructing the Gantt chart, you’ll run into the risk of having to recreate the entire project schedule if something is left out, a duration is misestimated, or another milestone has been missed.
When You Want to See the Scope and Cost of a Project
Gantt charts do not do well with dealing with the triple constraints of Project Management. The triple constraints are: Time, cost, and scope. Neither the cost nor the scope of a project is depicted on a Gantt chart. Due to this no matter how detailed the Gantt chart is, the full complexity can never be depicted. This is because the focus of the Gantt chart is only time.
Scroll along the chart to see time and scope constraints for the same project
When is Using a Gantt Chart a Good Idea?
When You Want to Look at the Timeline Across All Parts of a Project
One of the greatest reasons any project manager should use a Gantt chart software is the Time-centric guidance provided by the powerful and meaningful insights the chart gives. As an example, you can get the total amount of time it will take you to accomplish the project. Further, a Gantt chart not only gives you the possibility to visualize a sequence of events planned in your schedule, but it also enables the creation of a link between activities, also known as “dependencies”, allowing identification of the tasks that might get affected by another task.
When You Have a Concrete Plan for the Project
Gantt charts allow you to set accurate deadlines. When you are scheduling the whole project you are able to enter a starting date, a target end date, all the key dates or milestones in the middle, and even set a duration for each task. The whole project is scheduled and everything looks good so far. But what if something comes up unexpectedly? That is when using a Gantt chart becomes really interesting.
When starting a project, there’s a great chance that unexpected events will come up and have an impact on your schedule. A Gantt chart enables the scheduler to be very flexible, react quickly to unforeseen events, and modify the schedule basis project changes. Gantt charts make it possible to develop visual scenarios to react very quickly to those unforeseen events, for instance, what happens to the second milestone if the first task takes a week longer? That way, reactions to quick changes on the schedule can be visible.
When You Need to Allocate Resources Dynamically
By being able to look ahead on the Gantt chart, users can clearly anticipate, allocate, and maximize resources. The more closely you follow the chart, the better the chances of keeping project costs within budgets. This process also ensures an on-time completion. With a Gantt chart, you will have a very clear view of all the activities scheduled. You will know how long each activity should last, where do activities overlap, and optimal resource allocation. All you need is a few minutes to think about it and apply the right resource to the right task. This will also ensure that you aren’t wasting resources with under-optimized allocations.
When You Have to Manage Inter-Dependent Tasks
Gantt charts can make it very clear how various tasks are interrelated. They may have to rely on the completion of another task to meet specific objectives. These task relationships revolve around understanding the timing of each task, which then impacts other tasks listed. This can better assure the optimum workflow, maximize productivity and ensure overall project success. A dependent task is always tied to another one. Furthermore, you can only start once the first task is completed. You will need to account for other types of dependencies, such as start to start or finish to finish. Thanks to that you will be able to define the starting point of activity once the previous one is achieved.
Want to try making awesome Gantt Charts yourself?
Download and Try FusionCharts Now!