Table of Contents
Key takeaways
- PHP uses MySQL, which makes it easy to fetch and process dynamic data for pie chart creation.
- FusionCharts offers a powerful PHP module to create interactive, real-time charts effortlessly.
- You can build 2D, 3D, nested, and donut pie charts with FusionCharts in PHP.
- The chart can be rendered using a data string method by fetching data from MySQL and passing it as XML.
PHP is a widely used server-side scripting language for web development. Developers often pair PHP with MySQL, an open-source RDBMS, to retrieve and manage data efficiently. Using PHP and MySQL, you can create various charts, like a pie chart, to visualize data on websites or web apps.
While creating PHP charts from MySQL data may seem complex, using an efficient charting library simplifies the process. In this article, we’ll show how to create a pie chart in PHP MySQL, and why FusionCharts is a top PHP charting tool.
Why visualize data with pie charts in PHP using MySQL?
Pie charts in PHP using MySQL allow developers to display raw data from tables in a way that is simpler for users to follow. PHP Pie charts make it simple to show someone how a whole has been divided, such as by product sales, users’ demographic groups, or income by region.
PHP allows data to be processed on the server, and you can use MySQL for reliability, so it’s simple to create dynamic pie charts with their data. When used with a robust pie chart maker like FusionCharts, along with the stack, you can make charts that are engaging and easy to read for both reporting and users.
Why create a pie chart in PHP using MySQL?
A pie chart is essentially a circular graph, where the circle is divided into different slices or sectors. Each slice in the chart shows a proportion of the whole. You can create a pie chart in PHP MySQL and use it to represent categorical data and a parts-to-whole relationship. When it comes to creating a PHP pie chart, you can obtain the data for the chart statically by defining the data during the creation of the chart. However, the efficient way is to retrieve data dynamically from another source like MySQL. This way, your chart will always show up-to-date data. While there are several databases for PHP-based web development, MySQL is the most popular DBMS for PHP.
Here are a few reasons why most PHP developers prefer MySQL:
- Provides an easy way to save website data
- Helps automate the process of retrieving data
- Create highly interactive web apps
- Cost-effective and functional
- Superior performance
- Open source
- Fast and easy maintenance
- Compatible with almost every modern server, such as Apache and IIS
Why Use FusionCharts To Create A Pie Chart In PHP using MySQL?
Many open-source JavaScript chart libraries can create pie charts in PHP MySQL, but most are hard to use and only produce low-resolution static images. FusionCharts is a powerful, user-friendly option that renders beautiful and interactive charts/graphs using PHP in the browser. Its PHP module supports creating JavaScript pie charts and integrates easily with frameworks like Angular and React. Here are the main features of the PHP module for FusionCharts:
Can You Connect Charts Directly To Any Database Of Your Choice?
With the PHP module for FusionCharts, you don’t have to worry about JavaScript methods and objects. You can simply write your app in native PHP or any other major PHP frameworks, such as Laravel, Symphony, or CodeIgniter, and easily fetch data from your SQL databases, including MySQL, and directly create dynamic and interactive charts.
Does It Support a Wide Range of Charts and Graphs?
FusionCharts’ PHP module allows you to create more than 150 functional charts for your web apps. These include pie charts, line charts, bar charts, column charts, area charts, Gantt charts, and many more.
The PHP module also comes with event support for keyboard, mouse, and more. This feature allows you to add charts and graphs during any lifecycle phase of your app.
Does It Allow You To Create Interactive Charts?
Interactive charts make visualization even easier to understand, which in turn helps make informed decisions. With FusionCharts, you can create highly interactive charts that are responsive on all screen sizes.
FusionCharts supports a number of user interactions:
- Zooming (zoom in and out)
- Panning
- Dragable charts
- Enable users to switch between values on a chart or graph
- Add drill-downs to your charts
- Show or hide data series in column charts and many more
Can You Create Live Charts With PHP Module For FusionCharts?
The PHP module for FusionCharts supports real-time updates or live charts. These charts update automatically after a specific interval to show real-time data.
Does It Allow You To Export Charts and Dashboards?
While most charting libraries don’t allow you to export full dashboards, FusionCharts PHP chart generator offers this feature. It allows you to export full live dashboards in different formats, such as PDF and image. You can also easily add any new elements to your exported dashboards, such as logos, colors, and tables.
Is FusionCharts compatible with MySQL and PHP?
Yes, FusionCharts works seamlessly with MySQL and PHP. Using PHP, you can fetch data from MySQL and pass it as JSON to FusionCharts. It provides tools and examples to simplify integration, making it easy to create a pie chart in PHP and MySQL.
How easy is it to integrate FusionCharts in a PHP project?
Integrating FusionCharts in a PHP project is straightforward. Download the library or use a CDN, fetch data from MySQL with PHP, format it as JSON or XML, and render it with FusionCharts on your HTML page. The PHP module, clear documentation, and examples make creating interactive pie charts simple.
Which Type of PHP Pie Charts Can I Create With FusionCharts?
Whether you want to create a financial pie chart or a 2D/3D pie chart, FusionCharts supports a wide range of pie charts:
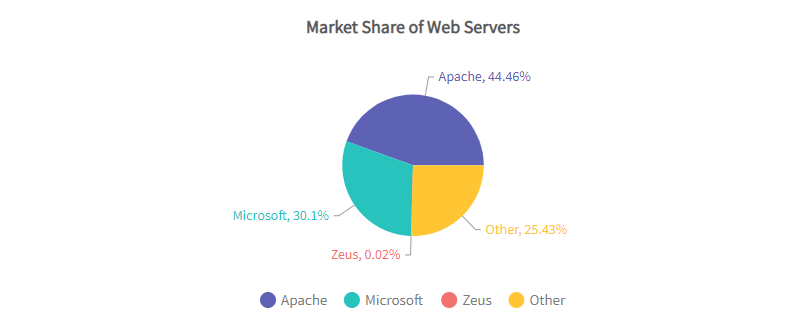
Pie in 2D and 3D
A 2D or 3D pie chart is great for representing the share of constituents as part of the whole. A 3D pie chart essentially adds depth to a plain pie chart and makes it visually appealing.
Nested Pie in 2D
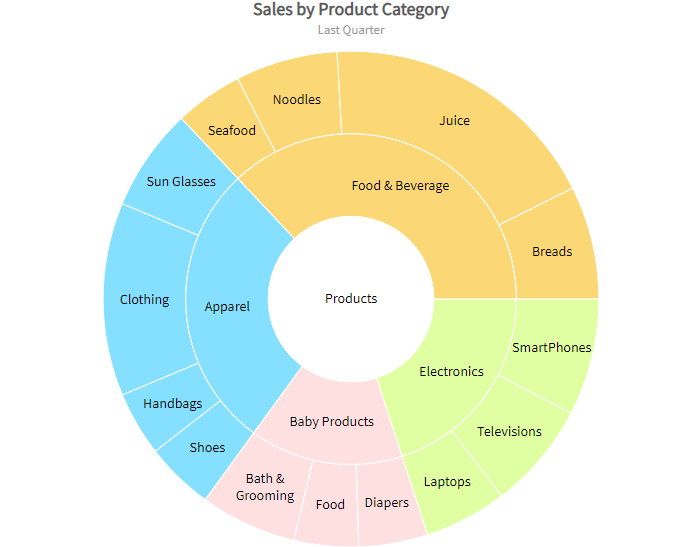
A nested 2D pie chart is a multi-level pie chart. You can you this PHP graph to represent symmetrical and asymmetrical tree structures.
Donut in 2D/3D
A donut 2D or 3D pie chart is great for depicting the share of constituents as part of a whole. However, it also allows users to slice out different components/sectors of the pie chart.
How Can I Create A Pie Chart In PHP and MySQL Using FusionCharts?
With FusionCharts, you can create a pie chart in PHP MySQL by using the data string method or the data URL method.
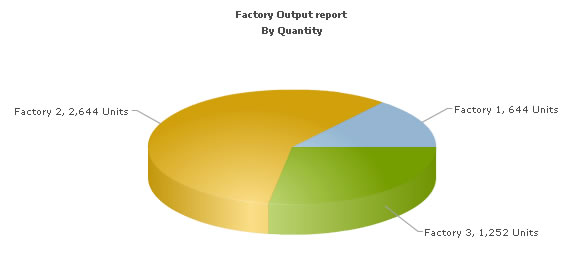
Here, we’ll create a sample pie chart for representing “Production by Factory” using the data string method. The database contains only two tables, namely “Factory_Master” for storing the name and ID of factories and “Factory_Output” for storing the number of units produced by factories for a specific date.
Here are the main steps for creating a pie chart in PHP MySQL :
- First, we need to include the FusionCharts.js JavaScript class and FusionCharts.php. This will help embed charts easily.
- Next, include DBConn.php to connect to the database.
- Generate an XML document and store it in a strXML variable.
- Render the Pie 3D Chart with data from $strXML.
Here is the sample code for creating the pie chart:
<?php
      //We've included ../Includes/FusionCharts.php and ../Includes/DBConn.php, which contains
      //functions to help us easily embed the charts and connect to a database.
      include("../Includes/FusionCharts.php");
      include("../Includes/DBConn.php");
      ?>
      <HTML>
         <HEAD>
        <TITLE>FusionCharts - Database Example</TITLE>
        https://../../FusionCharts/FusionCharts.js
     </HEAD>
     <BODY>
     <CENTER>
     <?php
   //In this example, we show how to connect FusionCharts to a database.
   //For the sake of ease, we've used a MySQL database containing two
   //tables.
   //Connect to the DB
   $link = connectToDB();
   //$strXML will be used to store the entire XML document generated
   //Generate the chart element
     $strXML = "<chart caption='Factory Output report' subCaption='By Quantity' pieSliceDepth='30' showBorder='1' formatNumberScale='0' numberSuffix=' Units'>";
   //Fetch all factory records
     $strQuery = "select * from Factory_Master";
     $result = mysql_query($strQuery) or die(mysql_error());
   //Iterate through each factory
       if ($result) {
          while($ors = mysql_fetch_array($result)) {
          //Now create a second query to get details for this factory
           $strQuery = "select sum(Quantity) as TotOutput from Factory_Output where FactoryId=" . $ors['FactoryId'];
           $result2 = mysql_query($strQuery) or die(mysql_error());
           $ors2 = mysql_fetch_array($result2);
          //Generate <set label='..' value='..'/>
           $strXML .= "<set label='" . $ors['FactoryName'] . "' value='" . $ors2['TotOutput'] . "' />";
          //free the resultset
           mysql_free_result($result2);
          }
     }
           mysql_close($link);
           //Finally, close <chart> element
           $strXML .= "</chart>";
           //Create the chart - Pie 3D Chart with data from $strXML
           echo renderChart("../../FusionCharts/Pie3D.swf", "", $strXML, "FactorySum", 600, 300, false, true);
        ?>
  </BODY>
</HTML>
The above code will render the following chart:
If you want to learn how to create a PHP MySQL chart using the data URL method, check out this article.
Tips for better pie chart visualization in PHP
To make sure your pie charts are useful, use the following tips:
- Limit categories: Make sure you don’t put too many categories in your email signatures.
- Use contrasting colors: Choose colors that are different from one another to ensure every slice stands out from the others.
- Label clearly: Label plots so that the percentage or value is obvious on the graph, which helps in interpreting pie charts accurately.
- Skip using 3D charts: Such charts make the data seem different than how it is in reality.
- Use legends smartly: Use legends to help when the slices are small and labels would be difficult to read.
Common mistakes to avoid while using PHP and MySQL together for creating pie charts
Creating pie charts with PHP and MySQL can be tricky. Avoid these common mistakes to ensure clarity, accuracy, and performance:
- Avoid including too many categories in your pie chart, as it can appear overloaded. Group similar data instead.
- Always clean and validate the data entering MySQL to prevent errors in your charts.
- For comparing multiple variables, use bar or column charts instead of pie charts.
- Add labels and legends to make the chart easier to understand.
Real-life examples: PHP pie charts in action
Here are some everyday uses where pie charts powered by PHP using MySQL prove useful:
- Sales by category: Present the number of sales for each category (such as electronics, clothing, home goods).
- User demographics: Using users’ profile details, break users down into gender or age groups.
- Customer feedback: Share survey results with customers by providing the answers received as a percentage.
- Project management: You can track the statuses of tasks or bugs in real time using project management tools.
- Education portals: List the students registered for each course or grade.
Whether it’s a flat or 3D pie chart in PHP, relying on charts, users can review information and make sound decisions more quickly on dashboards, admin panels, and reports.
Conclusion
PHP and MySQL are powerful for dynamic websites, and libraries like FusionCharts make it easy to create a pie chart in PHP. FusionCharts transforms raw data into clear, customizable visualizations, allowing developers to present PHP data effectively with interactive and well-documented charts.
Frequently asked question(FAQs)
1. How to generate charts from a MySQL database using PHP?
Connect to MySQL using PHP, extract data, arrange it in JSON or XML format, and present it using FusionCharts. Charts can be built in PHP without difficulty using this package.
2. How to create a connection between PHP with MySQL?
For database connection, use MySQLi or PDO while programming in PHP. An easy way to handle the connection and any errors is a new MySQLi () statement.
3. How to create a MySQL database?
You can create the database using the command line with CREATE DATABASE db_name; or through phpMyAdmin. After that, build tables and input your data for the charts to display.
4. Why is MySQL used with PHP?
Both PHP and MySQL are efficient, available for free, and were built with compatibility in mind. They help run powerful web applications and easily enable the use of FusionCharts.