Are you finding it hard to display your numerical data? Bar charts are always useful to help us represent numerical data visualization. The JS charts are highly useful, from infographics to PowerPoint presentations to financial reports. Moreover, they make the data more understandable. This article will tell you how to create bar chart in javascript.
Bar JS charts display the numerical data in the form of bars or columns. The best part to know is that there are different types of bar charts available these days. We can choose any of those types depending on our needs and requirements. Let’s explore how to create JS charts in this guide. Continue reading!

Table of Contents
What Are The Components Of A Bar Chart?
We must know that bar charts are made of important components no matter the type. Those components are explained as under:
Data Series Name
The data series works as an essential component of the chart. The whole chart responds according to the data in the data series. Whatever changes you make to the data series will automatically show up in the chart.
The Chart Grid
A chart grid gives us a frame of reference for our data. As a result, the data visualization becomes more simple and more understandable.
The Bars
The bars are what made them named bar charts. The bars help to visualize the data in the form of long or short rectangles depending on the data. Note that the bars are color-filled rectangles that have dimensions proportional to the data representation.
Chart Legend
Chart legend helps us to understand the relationship between the chosen colors and the represented data.
Now that we have learned about the important chart components, let’s learn how to create bar chart in JavaScript library.

How to Create Bar Chart in JavaScript Code Through Simple Steps?
Here are some simple steps that we must follow to create an amazing bar chart.
Creation Of An HTML Page
First of all, we have to create an HTML page. The HTML code will look like the one given below:
<!DOCTYPE html>
<html>
  <head>
    <title>JavaScript Bar Chart</title>
  </head>
  <body>
    <div id="container" style="width: 100%; height: 100%"></div>
  </body>
</html>
We will create a container that will act like a container for the chart. Moreover, we can set our own values for height and width in the above code. Let’s move to the next phase.
Reference All The Necessary Files
The next step is to reference the AnyChart JavaScript charting library. We will do it in the <script> tag in the <head> section. The example code is given below:
<!DOCTYPE html>
<html>
  <head>
      <title>JavaScript Bar Chart</title>
      https://cdn.anychart.com/releases/8.0.0/js/anychart-base.min.js
  </head>
  <body>
    <div id="container" style="width: 100%; height: 100%"></div>
  </body>
</html>
We will also write the JS chart sample’s whole code in the script tag. We have to add two more lines as under:
<!DOCTYPE html>
<html>
  <head>
      <title>JavaScript Bar Chart</title>
      https://cdn.anychart.com/releases/8.0.0/js/anychart-base.min.js
  </head>
  <body>
    <div id="container" style="width: 100%; height: 100%"></div>
    <script>
        <!-- chart code will be here -->
    </script>
  </body>
</html>
The JavaScript charting example’s whole code will be put into those two lines. Now, we have to move to the next section.

How to Create Bar Chart in JavaScript: Putting Together The Data
When we plan for data visualization, the first thing that comes to mind is the data itself. Let’s suppose we have a simple dataset. We will display simple two-dimensional chart data in columns X and Y. X tables to help us display categories or timestamps. On the other hand, Y contains values according to X.
We will show the 10 deadliest earthquakes in a certain century. The image given below contains the data:
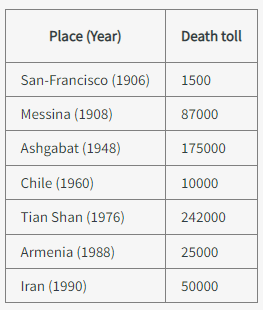
We will convert this data into a JavaScript object.
var data = {
  header: ["Name", "Death toll"],
  rows: [
    ["San-Francisco (1906)", 1500],
    ["Messina (1908)", 87000],
    ["Ashgabat (1948)", 175000],
    ["Chile (1960)", 10000],
    ["Tian Shan (1976)", 242000],
    ["Armenia (1988)", 25000],
    ["Iran (1990)", 50000]
]}
Now, we have to move to the next stages.
Writing Chart Code
We will use <script> and </script> tags to enclose the JavaScript charting sample code. We have to put the function that will await the completion of the first page.
<script>
anychart.onDocumentReady(function() {
    // the code to create a chart will be here
});
</script>
Then, we have to add the data:
anychart.onDocumentReady(function() {
    // the data
    var data = {
      header: ["Name", "Death toll"],
      rows: [
        ["San-Francisco (1906)", 1500],
        ["Messina (1908)", 87000],
        ["Ashgabat (1948)", 175000],
        ["Chile (1960)", 10000],
        ["Tian Shan (1976)", 242000],
        ["Armenia (1988)", 25000],
        ["Iran (1990)", 50000]
    ]};
});
Now, we must specify the type of JavaScript chart. In this case, we will select the bar chart type.
// create the chart
var chart = anychart.bar();

// add the data
chart.data(data);
Then, we will set the title of the chart.
// set the chart title
chart.title("The deadliest earthq
Then, we have to finish the chart and run it.
chart.container('container');
chart.draw();
We will get the results as under:
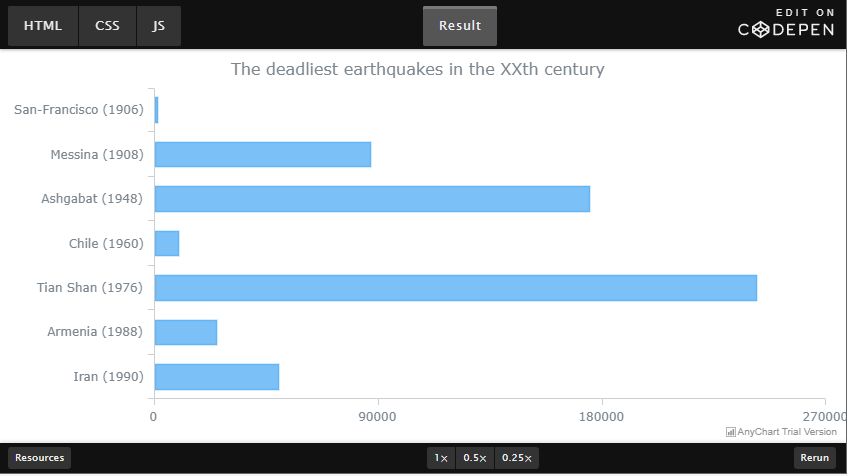
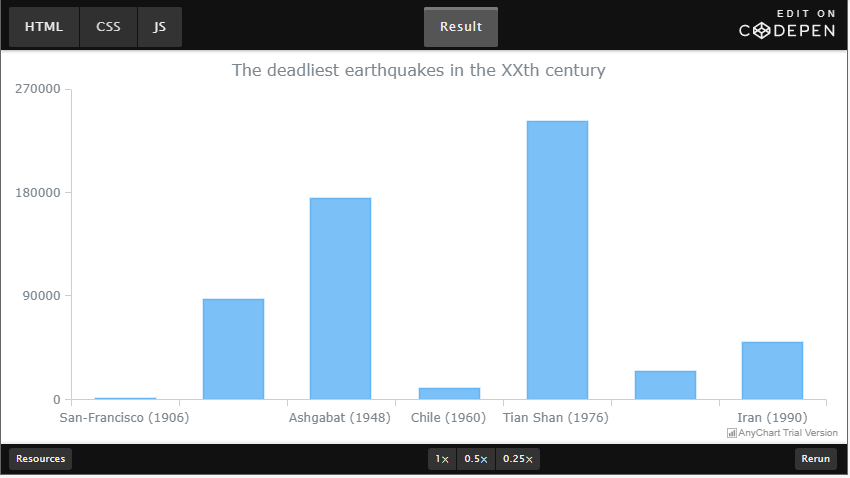
Chart Type Modification
If we want to arrange the data properly in the form of a vertical bar chart, then we will have to modify it. The code to modify the chart types is given below:
	// create the chart
chart = anychart.column();
Now, it will look like this:
Tune Bar Chart
We can tune the charts in multiple ways. It alters the general appearance and feel of the chart. The simplest way to do this is to change the theme of the chart. First, we need to link to the predefined themes as under:
https://cdn.anychart.com/releases/8.0.0/themes/dark_earth.min.jsThen, we will tell our chart to use it.
anychart.theme(anychart.themes.darkEarth);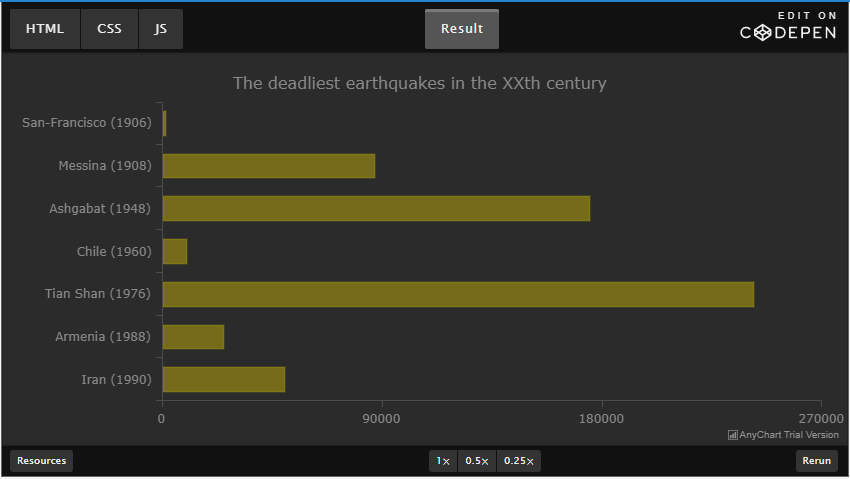
You can also visualize your data with this bar graph example given above.
Does FusionCharts Help To Create Bar Charts In JavaScript?
FusionCharts Suite XT gives us 100+ interactive charts and more than 2000 maps. It is simple to create a bar chart using the simplest JavaScript library of FusionCharts.It is the greatest tool available that helps us in creating effective charts. FusionCharts uses JS framework and server-side programming languages. It becomes easy to create JS charts for our enterprise and web apps.
How to Create Bar Chart in Javascript: Conclusion
We have learned that there is no difficulty in creating charts using JavaScript. It needs only a few simple steps to create amazing bar charts. The best part is that FusionChats is a great tool to use for building an interactive bar chart with amazing colors for charts.
How to Create Bar Chart in JavaScript: FAQs
Can You Create a Graph in Javascript?
Yes. We can use the chart.js library to create amazing charts using JavaScript.
What Is a Bar Chart With Examples?
It is a graph with rectangular bars. The most common example is the vertical bar graph. Some most common types are grouped, stacked, and segmented bar graphs.
Is Javascript Good for Data Visualization?
Yes. It is great for creating visual experiences.
Is Javascript Good for Graphics?
Yes. It can be used to enhance graphics.
Sign up for free now to create effective JS charts using FusionCharts.