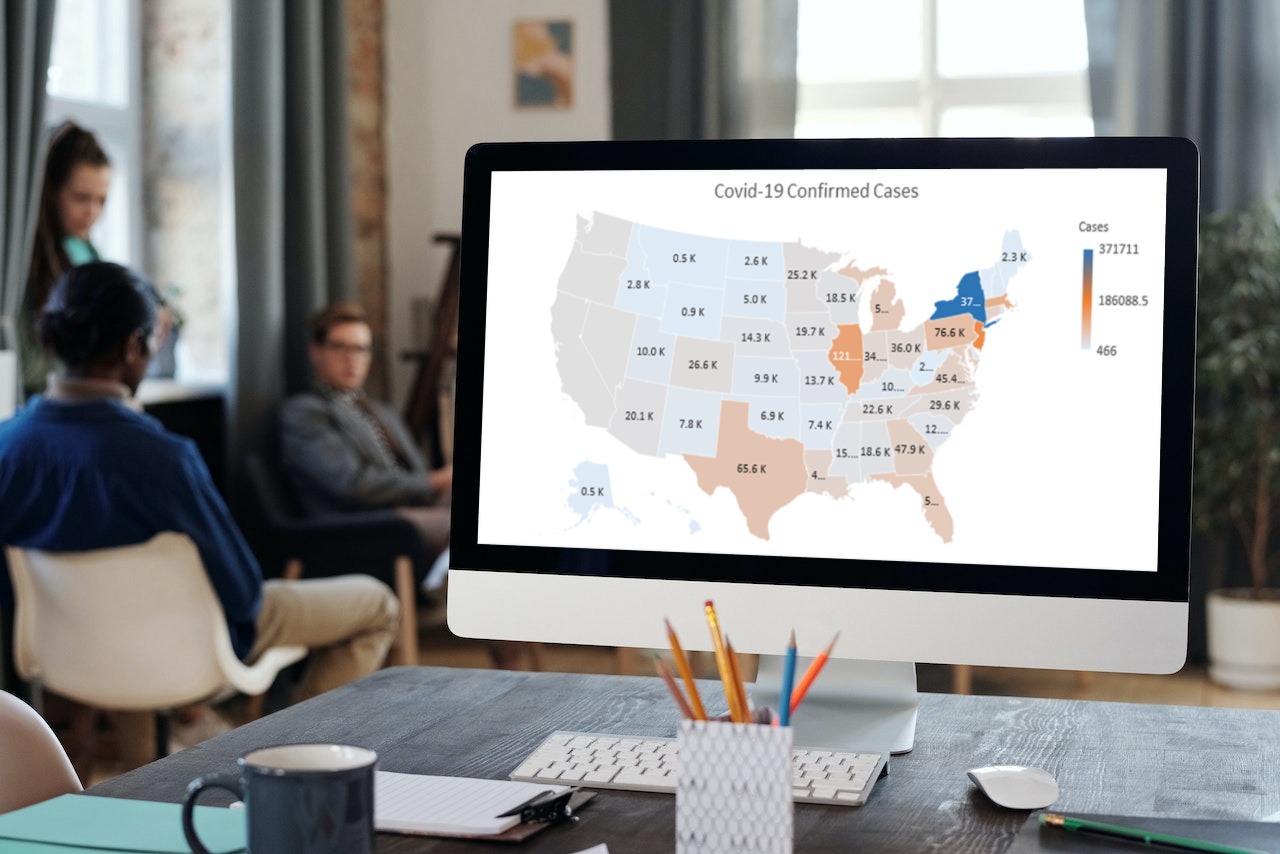
Today, you will find maps on almost all kinds of platforms. For instance, there are service area maps, sales territory maps, delivery area maps, a state map, or maps on any topic defined by States or ZIP Codes. This article will show how to create a custom map to identify all US states, mainly using FusionCharts.
Table of Contents
How To Create A Custom Map Using FusionCharts?

In this tutorial, you’ll learn how to use FusionCharts to create custom map of all the states in the United States, customize it manually, or import data from a spreadsheet and publish it on your website. These kinds of maps are crucial for location analytics.
To create a map with FusionCharts Suite XT, follow the four simple steps below:
1. Convert Data To JSON/XML Format:
FusionCharts Suite XT can read JSON and XML data formats as strings from a local or remote file. As a result, if you have data in any other format, like state asset distribution, you will need to convert it into a JSON/XML representation before building the map.
2. Include FusionCharts Suite XT Library On Your Page:
You can include the FusionCharts Suite XT JavaScript library with state map components on your HTML page using the <script> tag shown below:
| <head> <title>A Data Driven Map</title> <script type=”text/javascript” src=”fusioncharts/fusioncharts.js”></script> <script type=”text/javascript” src=”fusioncharts/themes/fusioncharts.theme.fusion.js”></script> </head> |
3. Create A Map Container On The Web Page:
Then, as shown below, you must create a container for your map in the form of a div> element:
<body>
<div id=”chart-container”>A US map will load here!</div>
</body>
4. Create An Instance Of The Map:
Finally, you must create a map instance, initialize it with your desired height and width (in pixels), and then set the JSON data source. To create a custom map, first, create a variable named Map.
In the populationMap variable, create a FusionCharts() object. Each map in your HTML page must have its own variable. Also, the initialization code is contained within the FusionCharts.ready() method. This prevents your map instantiation code from being called before the FusionCharts Suite XT library has been loaded and is ready to use on the page.
Use the alias maps/world to create a world map instance. FusionCharts Suite XT’s maps each have their distinct alias. Next, use the constructor’s width and height properties to specify the map’s width and height (in pixels).
Set the dataFormat parameter to JSON to specify the JSON data format. As the value of the dataSource parameter, the actual JSON data is embedded as a string. Use the list of key-value pairs in the chart object to set up the map’s aesthetic and functional attributes.
To indicate progressive thresholds, define various numeric ranges linked to a different color using the colorrange object. For example, to display the names and values for each continent, set the values of the showLabels and includeValueInLabels attributes to 1. Next, use the numberSuffix attribute with the value set to M to specify that the value’s suffix is a million.
Finally, render the map on the chartContainer element by invoking the render method.
How To Design A Basic Map?
Navigate to and select “Create a Map,” which will open a new tab with a map you can customize in two ways: manually drawing points and shapes or importing a spreadsheet.
Can You Draw A Customized Map?

Let’s begin by manually creating, drawing points or shapes on your map.
Insert A Marker
When the location you searched for appears in the pop-up window, click the “add to map” button to add a new marker to your map.
Draw Lines & Shapes Of The Map
To create a line, click along the map where you want your line to be.
Moreover, to create a shape, click along the map and be sure to connect the dots to create an enclosed form.
Add An Image/Video
You can create a gallery with multiple images and/or video links by clicking on the “+” button on the bottom right-hand side before saving.
Map Customization
You’ll see a box showing information about your map and its various layers. So far, all our changes have been to a layer on top of the map we see.
Can You Customize The Information In Your Map?

The information will most likely be in the “Shared With Me” or “Recent” tab. Next, Google will prompt you to select the location data column.
FusionCharts can create custom maps using many design libraries. If you cannot find the desired map styles, we can create a data-driven map from any geographic region, flight or cinema seating, or stadium seating. Please contact us on our website. We would be delighted to speak with you.
Insert Colors/Styles Customized For Each State
To change the icon style or color for each group, hover over each group and then click the paint bucket to customize.
Is It Possible To Embed Maps On Your Website?

This can be achieved by clicking the “share” button on the layers box, and then changing link sharing to public from private. Lastly, you will have to copy the embed code.
What Are The Key Takeaways?

In this article, we went over all the essentials one should know before creating a custom map. A map can be customized either by manually drawing points and shapes or importing a data file. Furthermore, these custom maps can be integrated into your webpages, as the embed code is auto-generated, making them more useful. This post even taught one how to create a basic map using FusionCharts’ map charting library.
Overall, FusionMaps XT has over 2000+ geographical maps. Including all countries, US states, and regions in Europe. For plotting business data like revenue by region, employment levels by state, and office locations.
