The value of data visualization tools has risen dramatically as a result of the widespread availability of large amounts of data. Managers and executives need powerful and interactive data visualizations to stay on top of their organization’s current trends and make educated future decisions.
If you are a React developer looking to provide your clients with an engaging and immersive data visualization experience, then look no further. FusionCharts has the perfect solution for you with the React component for the front-end integration of charts, graphs, and maps. Here is a guide full of useful tips to help you get the most results out of your various React chart placements.
Table of Contents
Is There a FusionCharts’ React component?
FusionCharts supports all tech-stacks including React. The React plugin for front-end integration is open source so you can easily integrate FusionCharts, graphs and maps as well as gauges in your software app.
What Type of React Charts are Available?
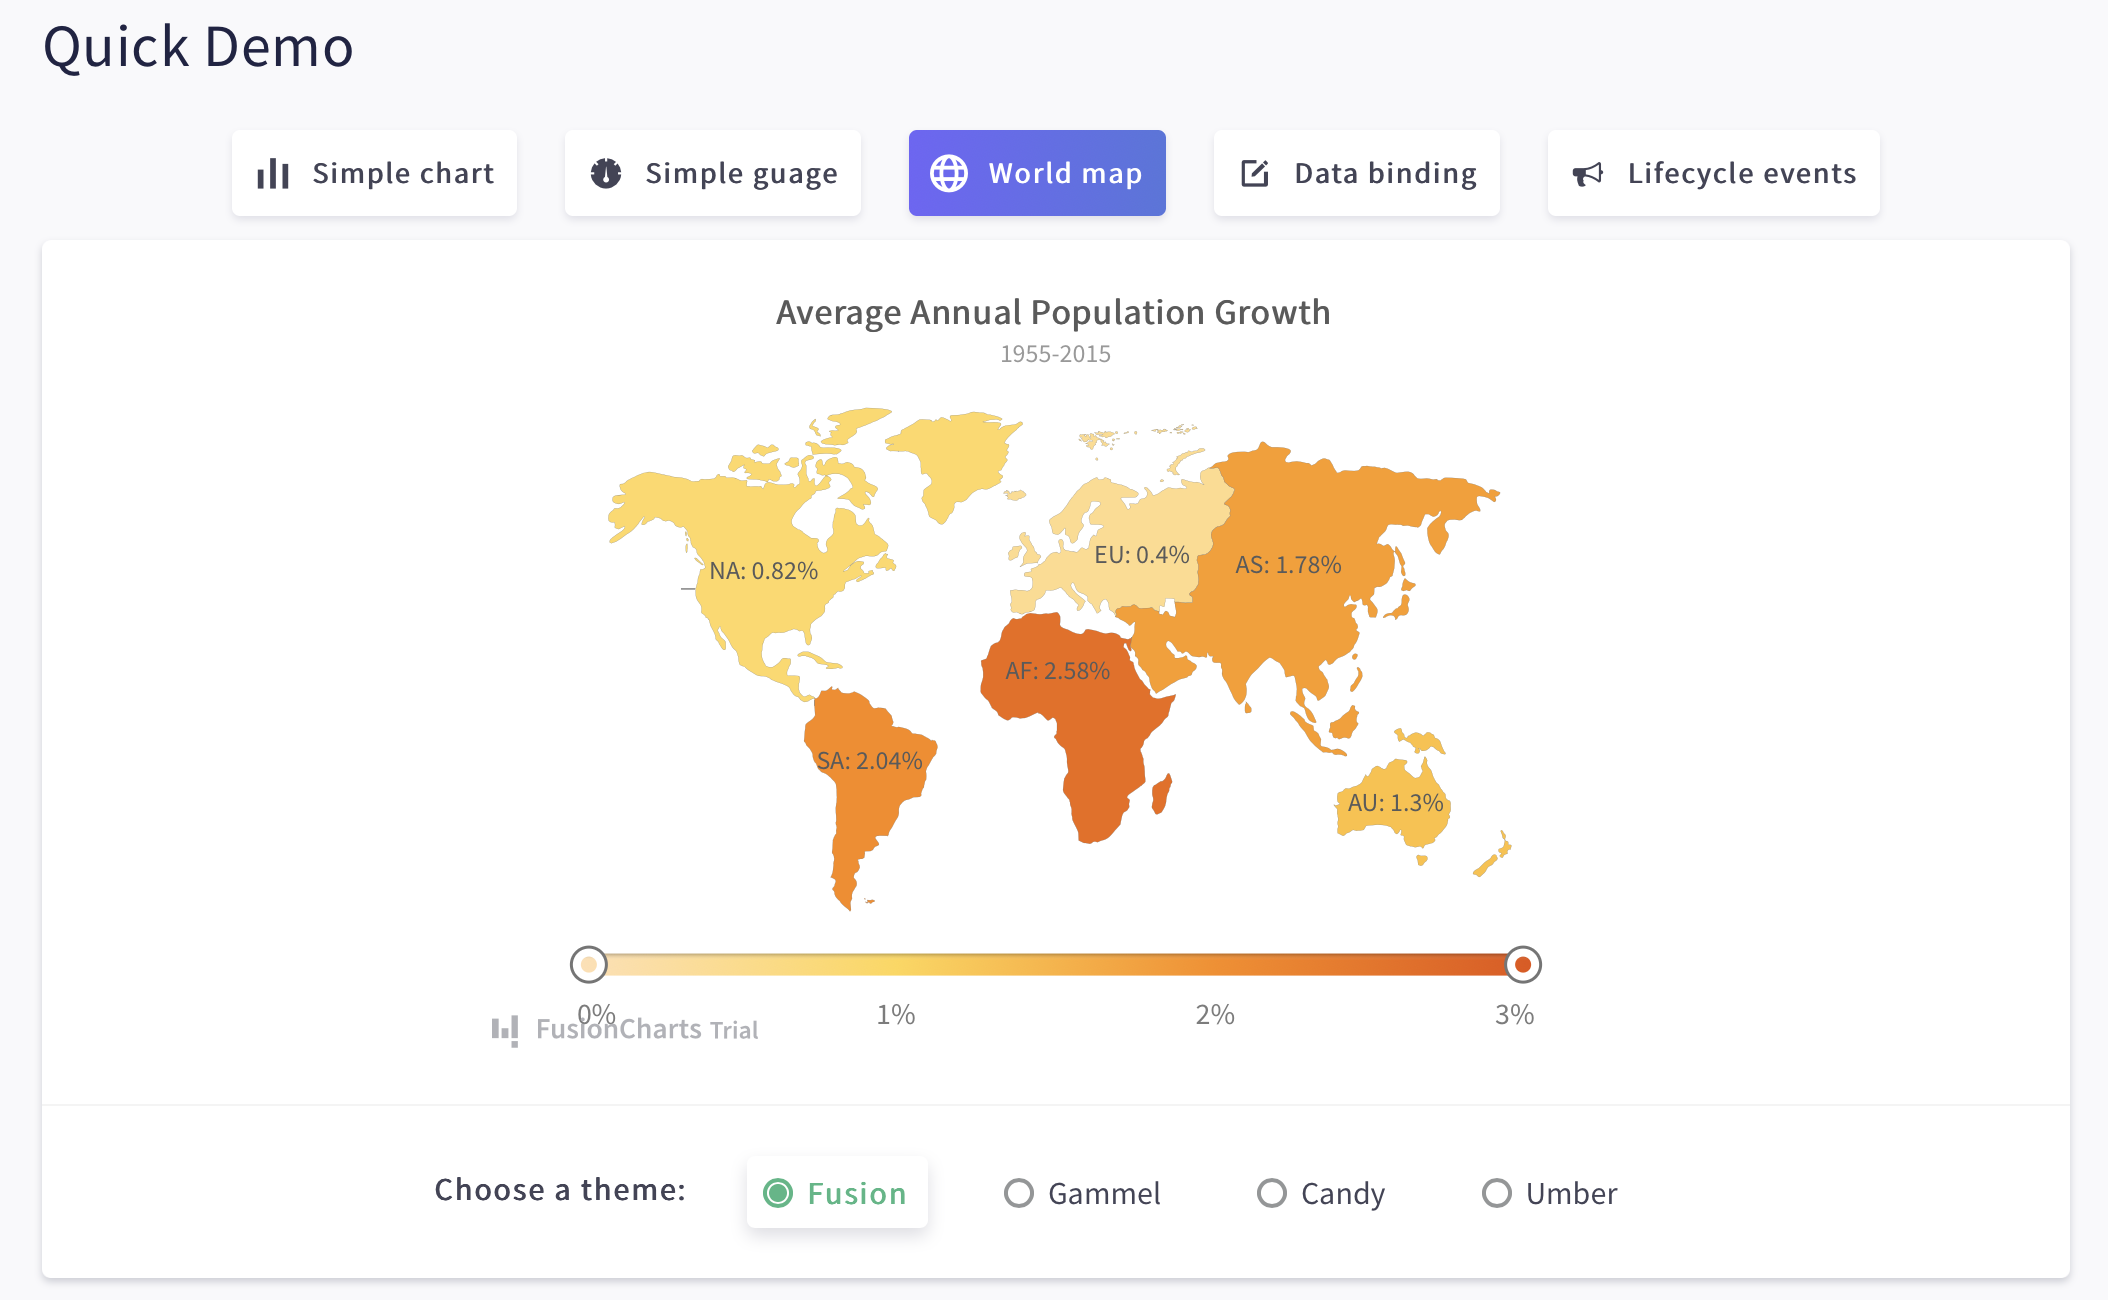
With the FusionCharts React component, you can add 100+ charts and 2000+ maps to your app. You can easily integrate the most commonly used charts — line charts, columns charts, bar graphs, and pie charts — into your React app. You can also include more specialized and domain-specific charts like radar charts, stock charts, Marimekko charts, and more.
Do React Charts Support Panning, Zooming, and Scaling?
All React charts are responsive by default. FusionCharts enables panning, zooming, and scaling when you embed them into your app. As a developer, you don’t need to do a thing to add this feature to your React charts.
Can I Add Drill-Downs to React Charts?
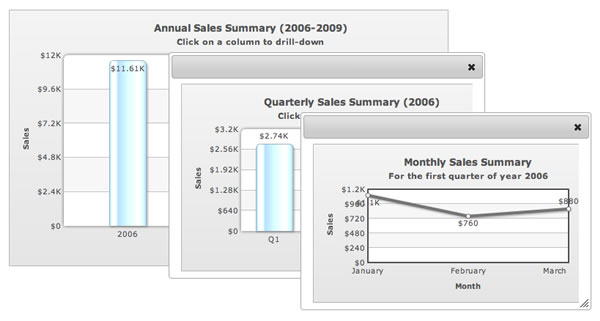
Yes, absolutely. With the drill-down feature, each data point acts as a hotspot. You can customize user clicks on individual data points by opening a new window with a more detailed chart. You can also add a pop-up or tooltip.
Can I Export a React Chart?
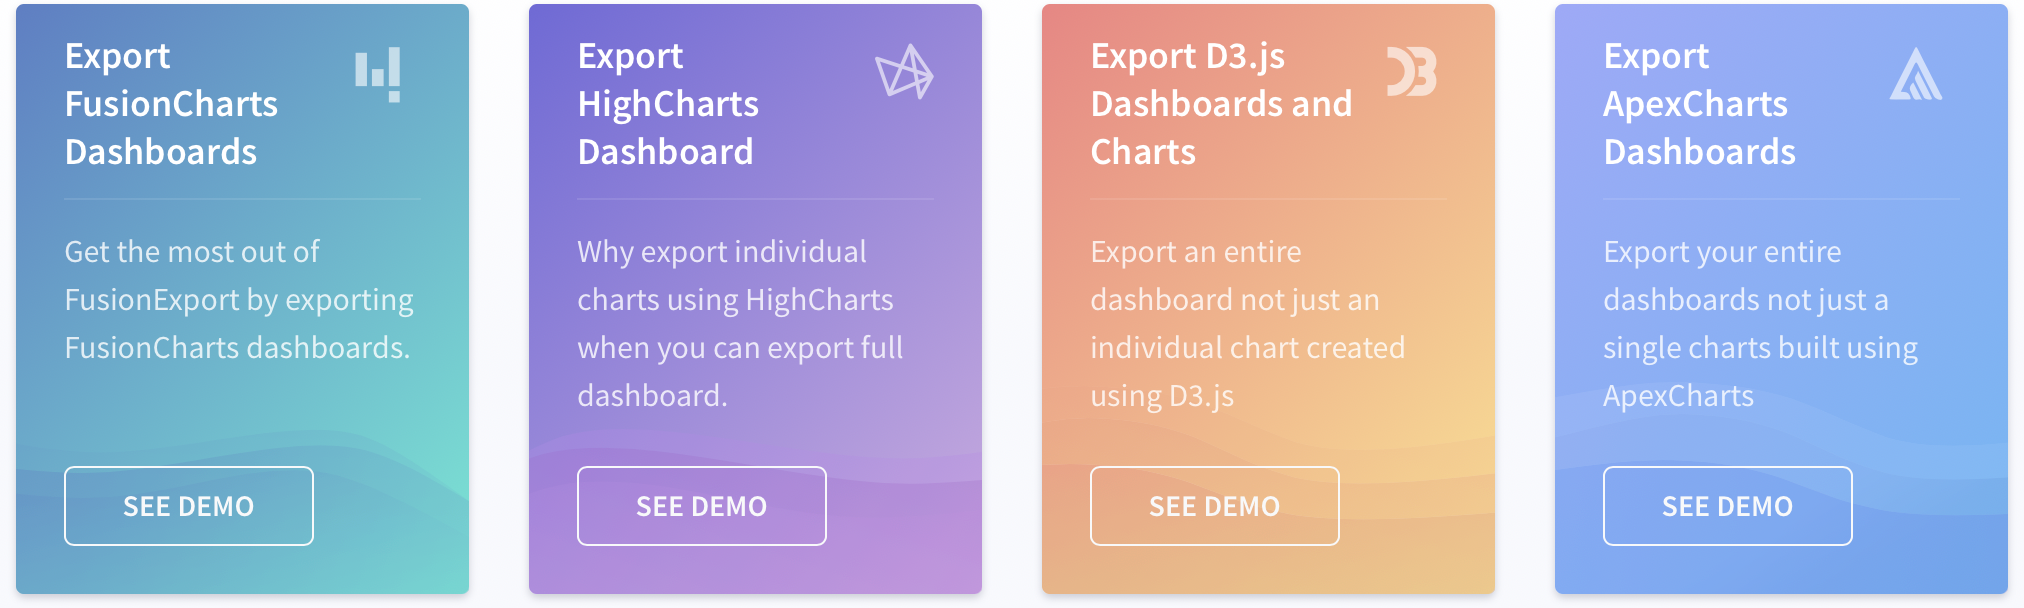
You can export all React charts to a .png, .jpg, or .svg image file using the FusionExport server. You can also export charts to .pdf format for emailing and distribution.
Are Real-Time Updates Possible in React Charts?
React charts support data streaming charts, which update themselves in real-time at user-defined intervals without additional page refreshes. FusionCharts automatically fetches data from the server and updates the React chart in real-time.
Can I Make React Charts Interactive and Responsive?
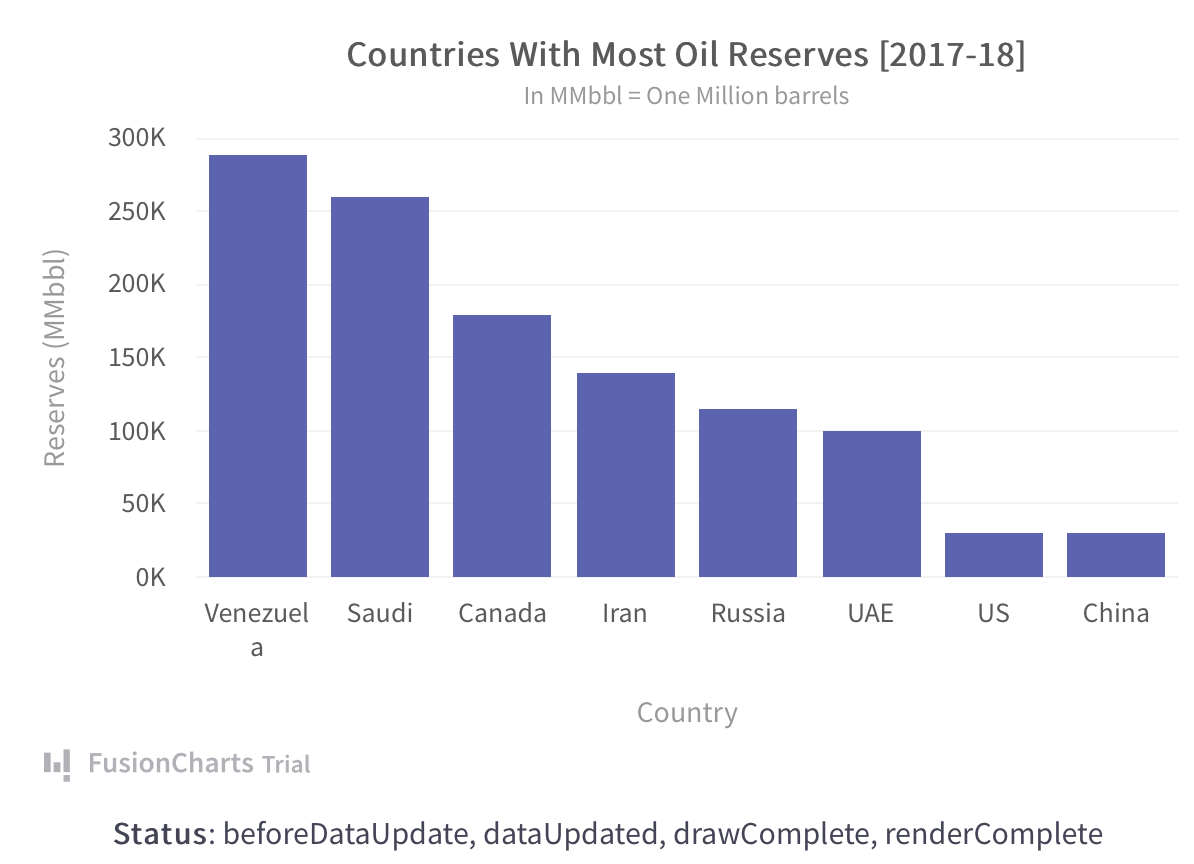
Of course! You can define all types of event handlers for user events. This includes keypresses and mouse events. Can also capture all types of data events at any stage of your chart’s lifecycle. You write and control the event handlers for data fetching, chart loading, chart rendering, and more.
Can I Create a Dashboard With React?
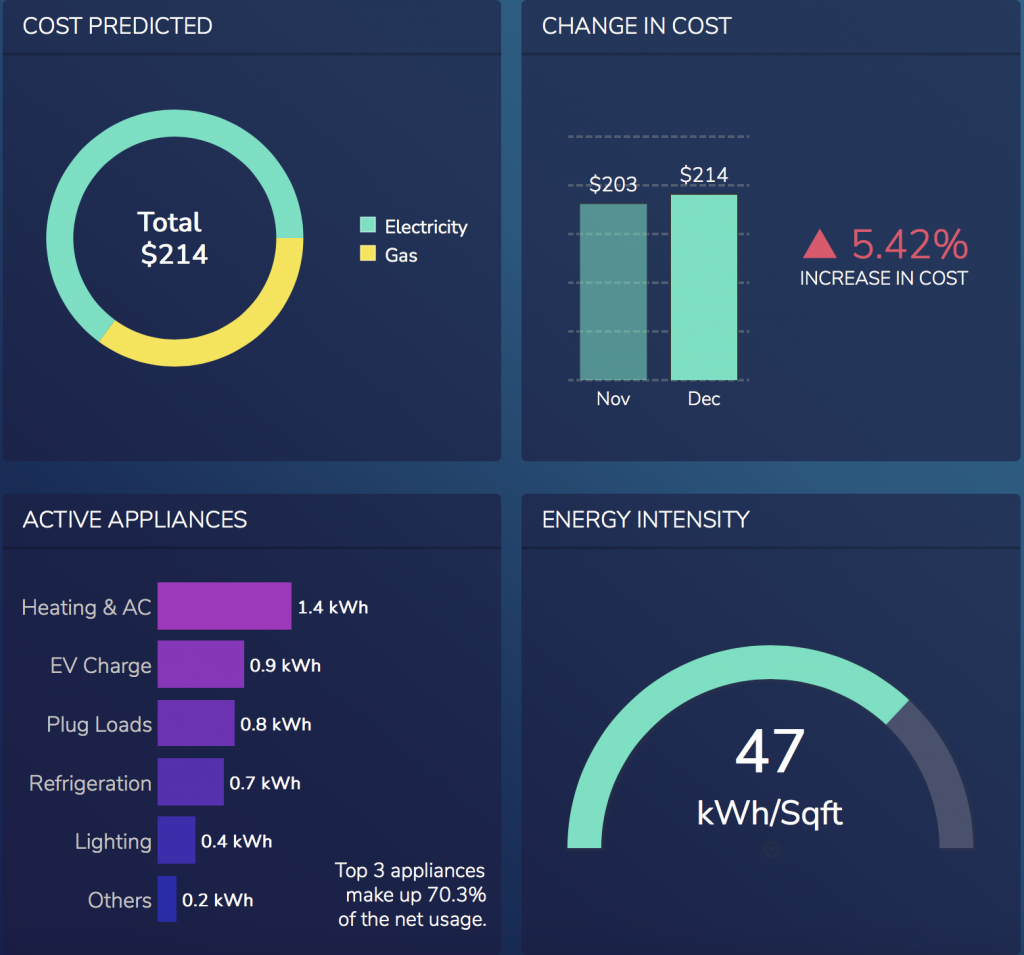
With React, you can also build business dashboards quickly and easily. Here is the source code for 20+ React dashboards. These include dashboards for different domains and different industries. Some examples are:
Is There Documentation to Get Started With My First React Chart?
Of course. FusionCharts comes with extensive documentation. This tutorial explains all the steps you need to build your first react chart using FusionCharts. You simply have to install FusionCharts and use the react-fusioncharts component as described in this tutorial.
How Do I Sign Up For FusionCharts?
FusionCharts is a beautiful library for creating responsive and interactive charts, graphs, and maps. You can easily integrate FusionCharts in your React app using the FusionCharts React component. With stunning interfaces, efficient data loading power, beautiful visualizations, extensive documentation, easy-to-use APIs, and lots more features, FusionCharts is the first choice for more than 800,000 developers over 28,000 companies.
Make the most of your data and sign up for a FusionCharts trial.
