Shipment Analysis Dashboard
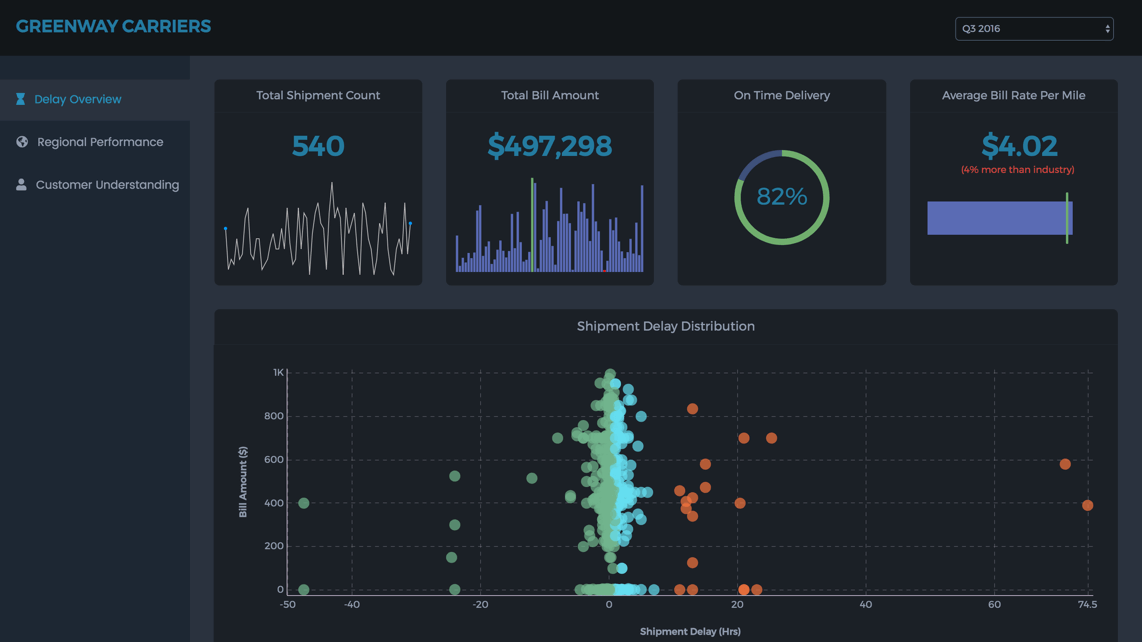
Make better decisions by getting a 360° view of your shipment performance. This dashboard can help you monitor, analyze and understand the monthly, quarterly, and semi-annual performance of a shipper. Using this dashboard, you can know the shipment performance across regions, get an overview of the shipment delay, and understand the important customers better.
This sample dashboard is built using FusionCharts Suite XT, which needs a license for commercial use.
Key features
- Track shipment KPIs and compare them against the industry benchmark
- Monitor business performance across different regions
- Identify important customers by knowing their volume of shipment and avg. value of each shipment
- Get a detailed understanding of delay in shipments
FusionCharts products used
Technologies used
How to get started with this dashboard
Environment Setup
- Make sure you have Node JS >= 8.10 and npm >= 5.6 and Angular is installed on your machine
Project Files Setup
- Create a folder and extract the zip
- Navigate to the extracted folder in terminal
- Delete the file 'package-lock.json'
- Install the dependencies by running the following command
npm installornpm i - Go to
clientfolder and runnpm installornpm i - Install MongoDB Server
- Import the data to MongoDB by running the following command:
node data/insert-into-db.js - Open config.json in
client/srcfolder, changeCURR_MODEtolocal - To start server, run the following
npm run start - To start client, run the following, in
clientfoldernpm run start
Similar Dashboards
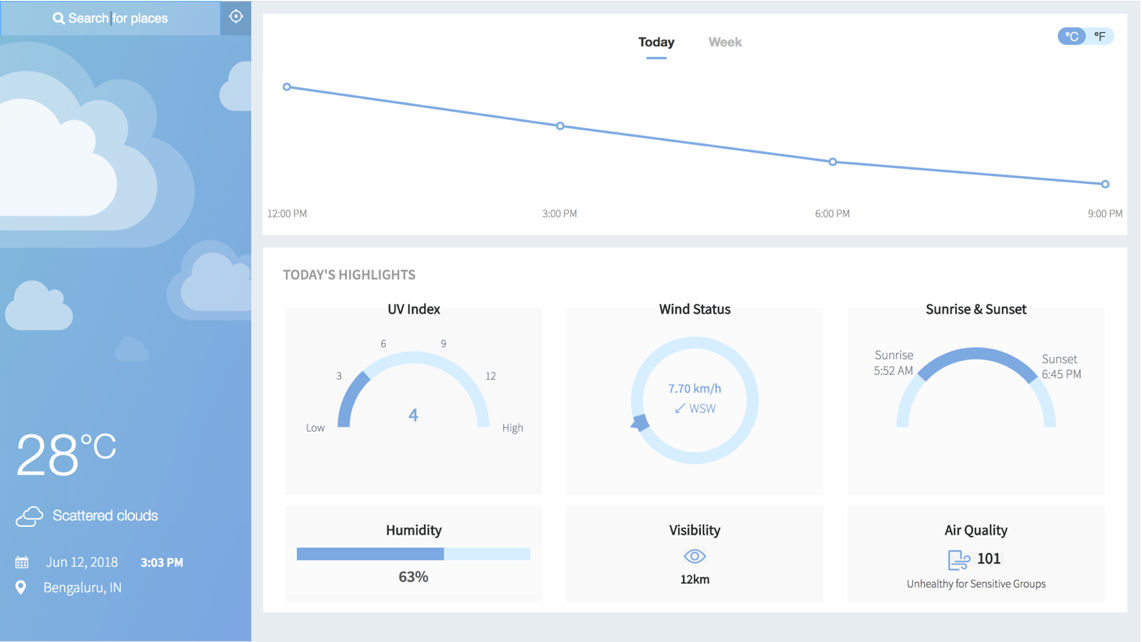
Smart Weather Dashboard
Monitor weather patterns to plan your day, streamline outstation visits, and anticipate inclement climate - or embed the dashboard in larger...
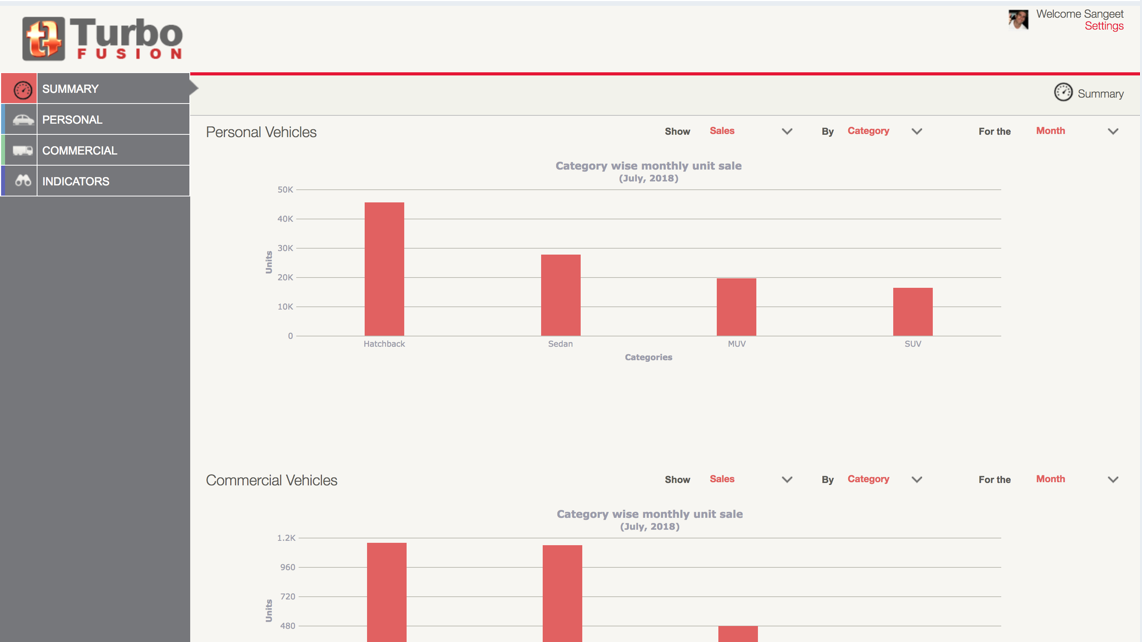
Automotive Manufacturing Management Dashboard
Extract actionable insights from research data on market conditions and consumer behavior to improve profit margins and streamline business ...
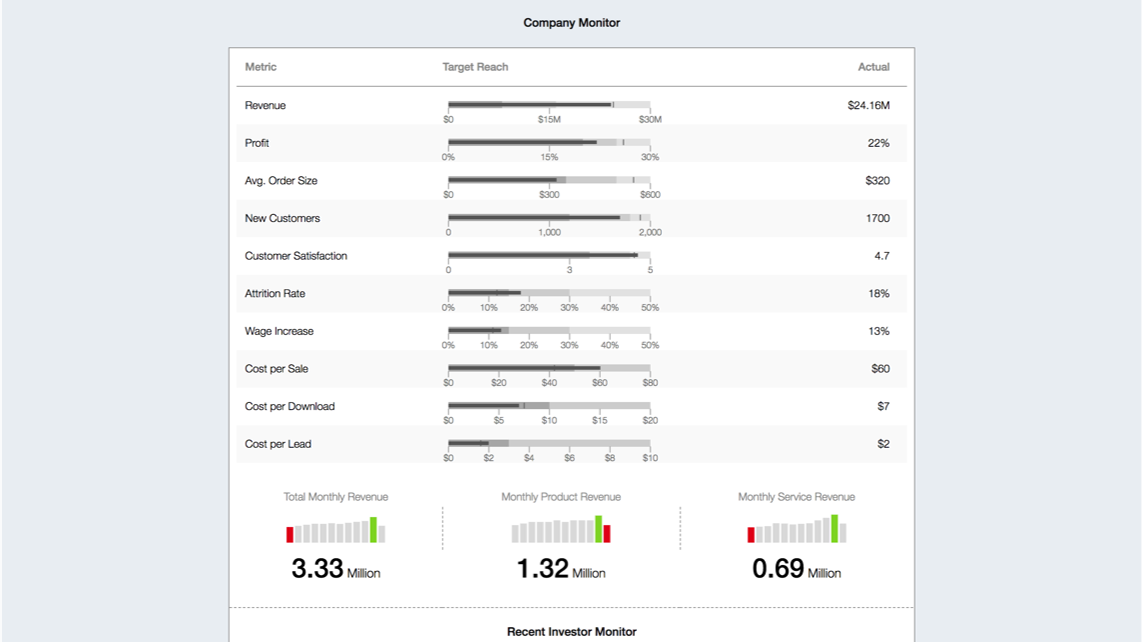
Business Operation Monitoring Dashboard
Track intra-organizational KPIs, monitor functional metrics (sales, marketing, HR, and more), and trump competition using competitor metrics...