Quick Answer
You can add interactive charts to a TypeScript project using a JavaScript charting library that supports TypeScript. Install the library, import the required chart modules, define your data and chart configuration, and render the chart. You can then add features such as custom tooltips, zooming, and real-time data updates. This tutorial walks through the process using FusionCharts.
Table of Contents
Introduction
Charts make complex data easier to understand at a glance. They allow users to scroll through history, hover over details, and even see numbers update in real time. In a complex data ecosystem, that’s no less than a superpower.
However, if you’re building a TypeScript application and want to add charts in an existing dashboard, analytics panel, or any UI, you cannot do it directly. TypeScript doesn’t support visuals. But you can do this using JavaScript charting libraries.
In this tutorial, you will learn how to set up a TypeScript project, install a charting library, configure chart data, and render an interactive chart. In the next tutorial in this series, we’ll extend this implementation to React + TypeScript.
Let’s learn this with FusionCharts as a step-by-step example.
FusionCharts with its comprehensive JS chart library powered by 100+ real-time & domain-specific chart types and 2000+ advanced maps with add-ons, makes a perfect choice for building modern embedded analytics. Other than this, we’ll also cover key considerations when choosing the right charting library. So let’s get started!
What Are TypeScript Charts?
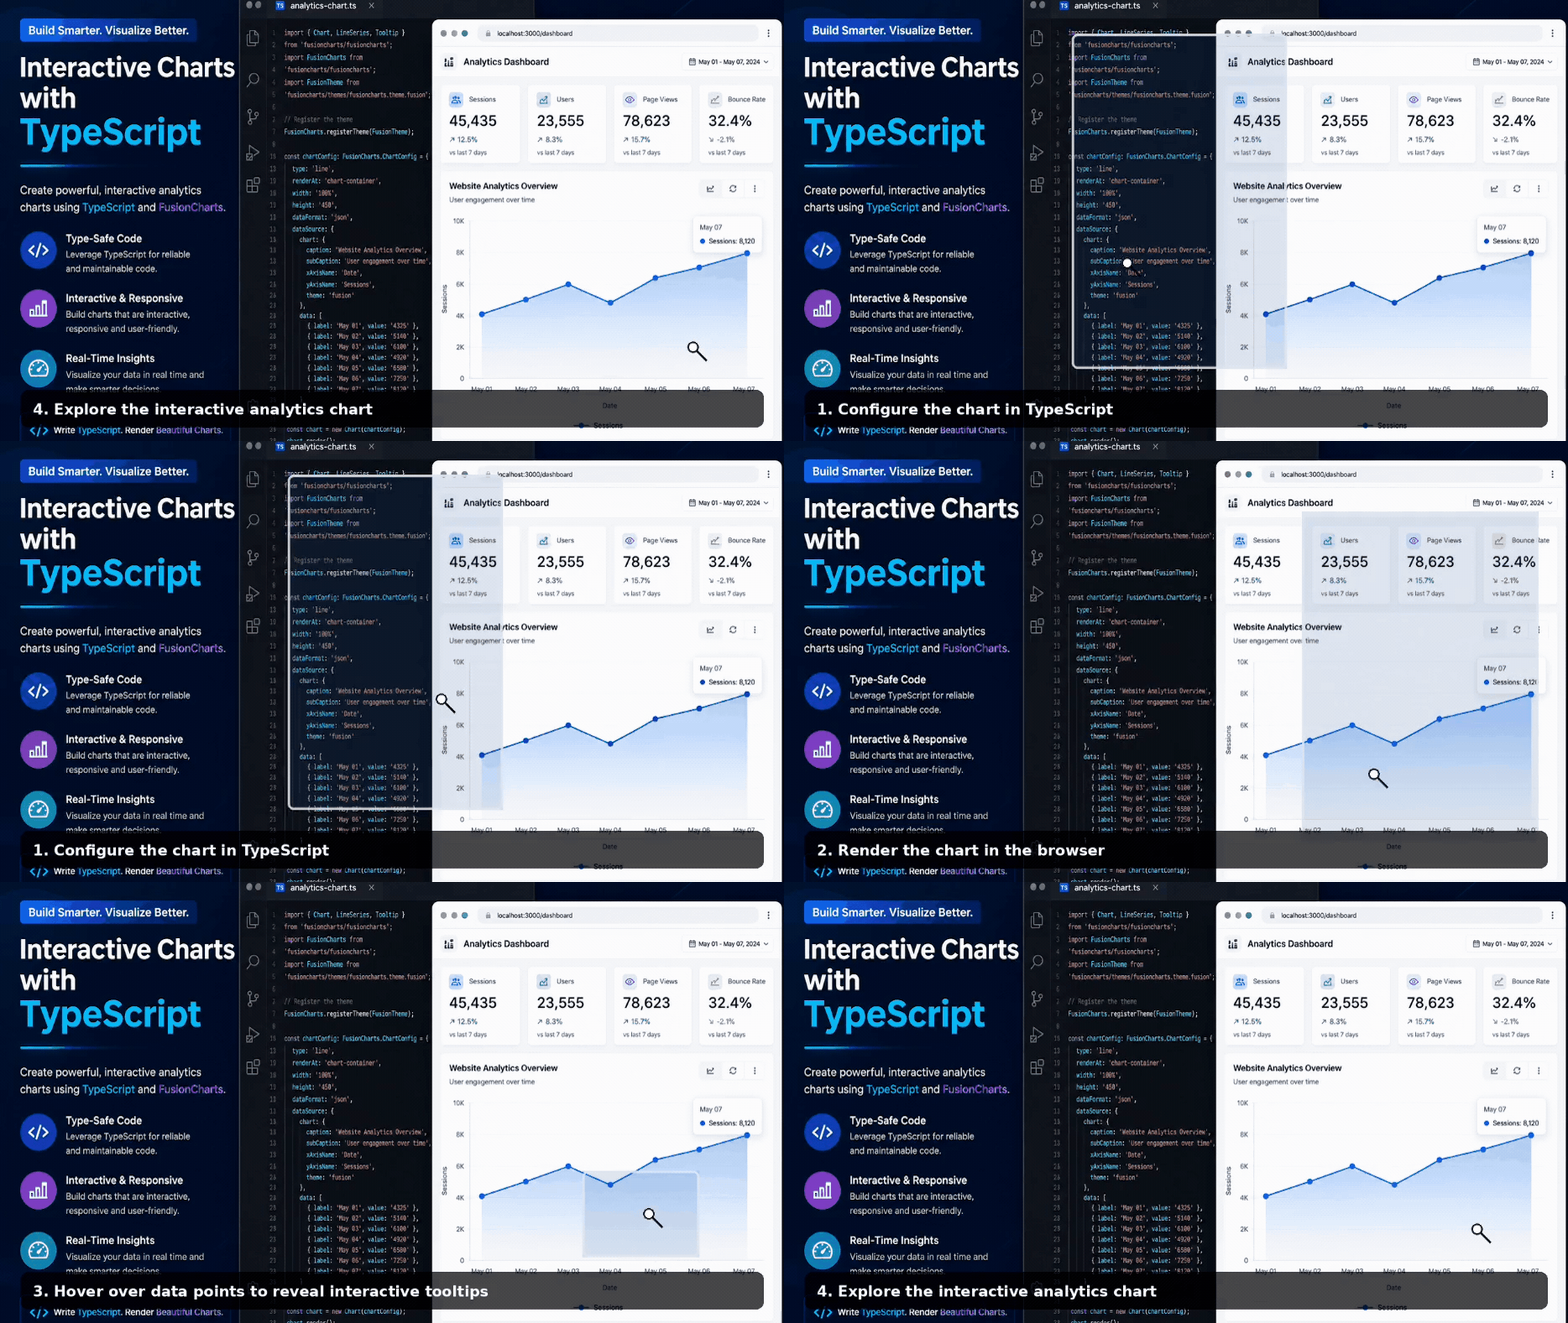
“TypeScript charts” simply refers to charts used in a TypeScript application. The charting library handles the visualization, while TypeScript can provide type checking for chart data, configuration, and APIs when the library includes TypeScript definitions.
This becomes particularly useful when an application has larger chart configurations or multiple charts with different data structures.
A charting library with good TypeScript support can provide:
- Compile-time error detection. Type checking can catch invalid data types and configuration errors before the application runs.
- IDE autocomplete. Type definitions allow your editor to suggest supported properties and APIs as you write the chart configuration.
- Easier maintenance. Typed data and configuration objects make chart implementations easier to understand and maintain as an application grows.
You don’t need advanced TypeScript knowledge for this tutorial. Basic familiarity with interfaces, imports, and configuration objects is enough.
What Should You Look for in a TypeScript Charts Library?
Not every chart library will suit every project, so check a few things before you decide.
| Requirement | What to Evaluate |
|---|---|
| TypeScript development | Type definitions and typed APIs |
| Dashboards | Chart variety and layout flexibility |
| Interactivity | Events, tooltips, zoom, drill-down |
| Large applications | Performance and maintainability |
| React / Angular / Vue | Official framework integrations |
| Enterprise use | Support and licensing |
| Customization | Themes, styling, configuration APIs |
How to Integrate Interactive Charts in a TypeScript Project
Now let’s walk through the hands-on implementation. Let’s build a simple interactive column chart with TypeScript and FusionCharts.
Step 1: Create a TypeScript Project
Start with a minimal setup – you don’t need a full framework for this walkthrough.
mkdir ts-charts-demo && cd ts-charts-demo
npm init -y
npm install --save-dev typescript
npx tsc --init
You can keep the TypeScript config simple for this project. Here’s a basic tsconfig.json to start with:
{
 "compilerOptions": {
 "target": "ES2017",
 "module": "ESNext",
 "moduleResolution": "bundler",
 "lib": ["ES2017", "DOM"],
 "esModuleInterop": true,
 "strict": true,
 "outDir": "dist"
 },
 "include": ["src/**/*.ts"]
}
This configuration enables strict type checking while keeping the setup simple for a browser-based project.
Step 2: Install the Charting Packages
Install FusionCharts through npm:
npm install fusioncharts
FusionCharts ships native TypeScript definitions (index.d.ts) directly inside the package. You do not need to install a separate @types/fusioncharts package.
Step 3: Import and Configure FusionCharts
Next, import the core library and chart modules to set up the initial configuration.
import FusionCharts from "fusioncharts";
import Charts from "fusioncharts/fusioncharts.charts";
import FusionTheme from "fusioncharts/themes/fusioncharts.theme.fusion";
// Register the chart and theme modules against the core FusionCharts object Charts(FusionCharts);
FusionTheme(FusionCharts);
This pattern – import the core, import a module, call the module as a function passing in the core- is how FusionCharts’ modular build works. It only needs to run once per module, at app startup.
Step 4: Define the Chart Data
Charts need data, and this is where TypeScript starts pulling its weight – you can define an interface for your dataset so the shape is enforced before it ever reaches the chart.
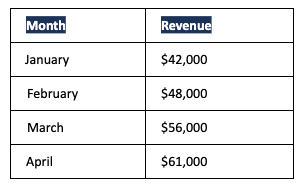
Here’s the sample dataset we’ll use throughout this tutorial:
interface RevenuePoint {
 label: string;
 value: string;
}
const revenueData: RevenuePoint[] = [
 { label: "January", value: "42000" },
 { label: "February", value: "48000" },
 { label: "March", value: "56000" },
 { label: "April", value: "61000" },
];
Note that FusionCharts expects numerical values passed as string types inside data arrays.
Step 5: Configure the Chart
Type your configuration object using FusionCharts.ChartObject to get full autocomplete for chart dimensions, data formats, and axis properties:
const chartConfig: FusionCharts.ChartObject = {
 type: "column2d",
 renderAt: "chart-container",
 width: "600",
 height: "400",
 dataFormat: "json",
 dataSource: {
 chart: {
 caption: "Monthly Revenue",
 subCaption: "Q1–Q2 2026",
 xAxisName: "Month",
 yAxisName: "Revenue (USD)",
 numberPrefix: "$",
 theme: "fusion",
 },
 data: revenueData,
 },
};
A few configuration properties worth understanding rather than just copying:
- Chart type determines which visualization renders – this is the one property you’ll change most often when experimenting.
- Data format tells the library how to interpret the dataset you’re passing in.
- Caption and axis labels aren’t cosmetic – they’re what make a chart legible to someone who isn’t you.
Step 6: Render the Chart
Finally, render the chart into a container element.
const chart = new FusionCharts(chartConfig);
chart.render();
<div id="chart-container"></div>
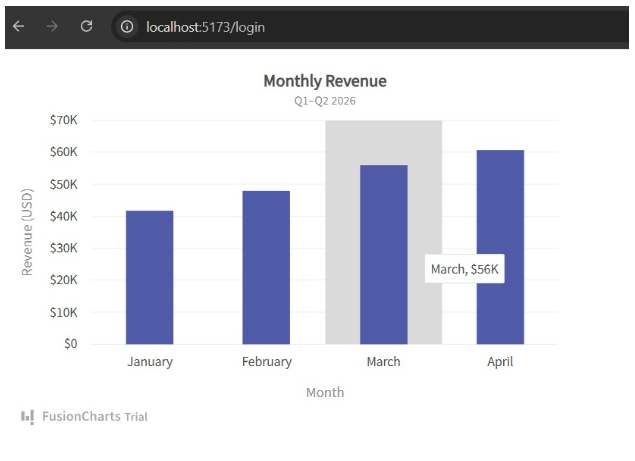
You now have a working column chart built entirely with typed TypeScript code.
Ready to build your own? Try interactive charts in your local environment to see how it fits your workflow.
How to Switch Between Chart Types in FusionCharts?
Because FusionCharts relies on a unified schema, changing visualizations doesn’t require rewriting your data setup. In most cases, updating the type property is all it takes to switch chart types.
const chartConfig: FusionCharts.ChartObject = {
  ...previousConfig,
  type: "bar2d", // was "column2d"
};
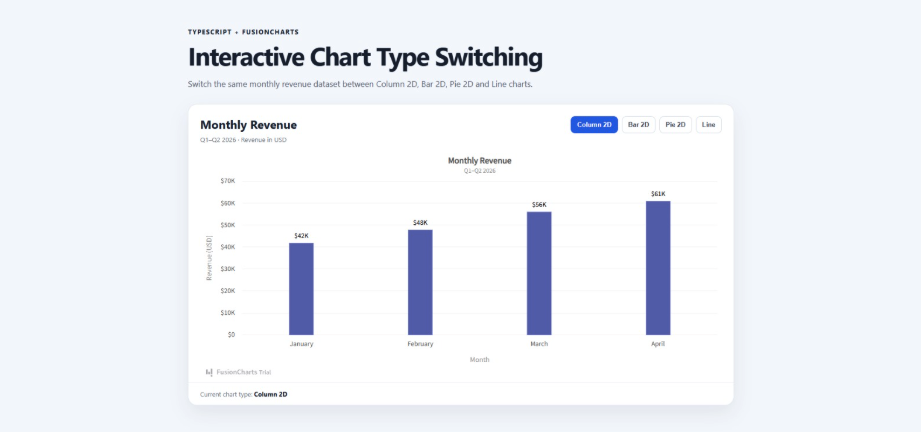
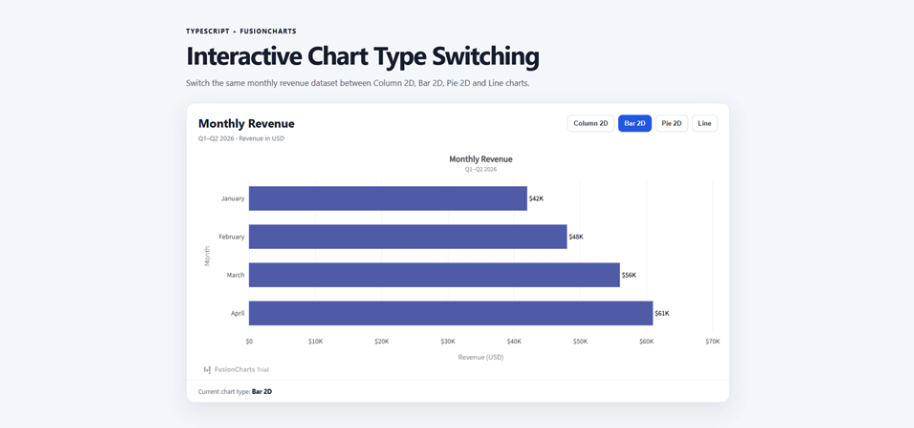
That’s it: the data, the container, and the render call all stay exactly as they were in Step 6. Want a pie chart instead? Same pattern: type: “pie2d”.
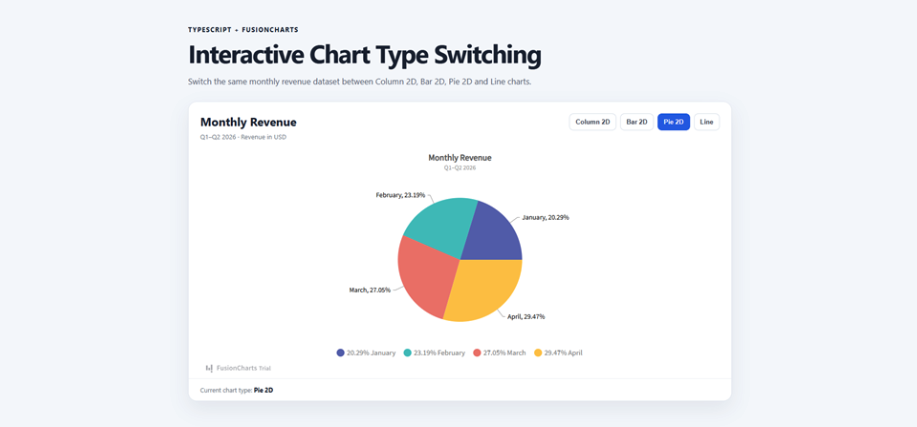
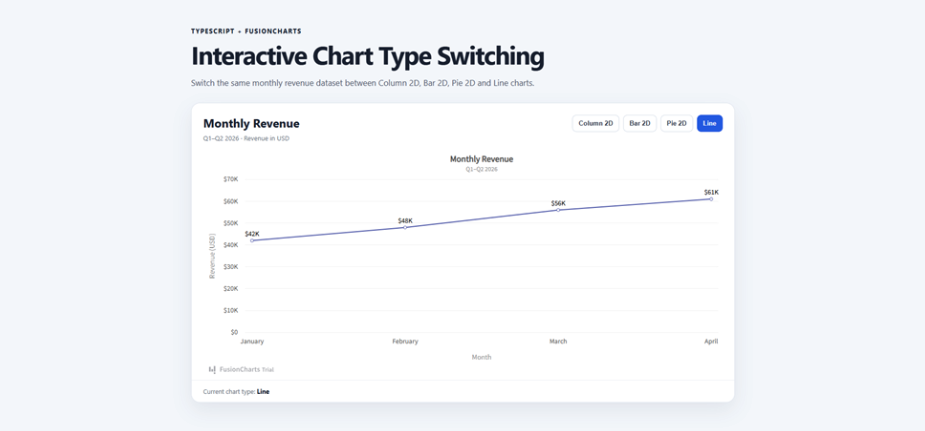
A line chart? type: “line”. The type property is the switch; everything downstream of it just follows along.
A couple of chart types do expect a slightly different data shape (pie charts, for instance, don’t use xAxisName/yAxisName since there’s no axis), so check the chart type’s config reference if something renders blank after a switch; that’s almost always a data-shape mismatch, not a bug.
Adding Interactivity: Tooltips, Zoom, and Real-Time Data Updates
Once a chart is rendering and you can switch its type on the fly, the next step is usually making it feel alive – letting users hover for context, zoom into a busy range, or watch values update as new data arrives. FusionCharts exposes all three through configuration properties and methods, so none of this requires a different setup from what you already have.
Custom Tooltips
Add toolText to an individual data point to customize its tooltip. FusionCharts also supports plotToolText when you want to define a common tooltip format for data plots. Tooltip macros such as $label and $dataValue insert the corresponding label and formatted value at runtime.
const revenueDataWithTooltips = revenueData.map((point) => ({
  ...point,
  toolText: "$label revenue: $dataValue",
}));
Zoom and Pan
For dense time-series data, FusionCharts provides the zoomline chart type. Users can drag across the chart to zoom into a specific range and then use the scrollbar to move through the zoomed data.
To control which portion of the dataset is shown when the chart first renders, set displayStartIndex and displayEndIndex:
const zoomChartConfig: FusionCharts.ChartObject = {
  type: "zoomline",
  renderAt: "chart-container",
  width: "600",
  height: "400",
  dataFormat: "json",
  dataSource: {
    chart: {
      caption: "Monthly Revenue",
      xAxisName: "Month",
      yAxisName: "Revenue (USD)",
      numberPrefix: "$",
      theme: "fusion",
      displayStartIndex: "0",
      displayEndIndex: "5",
    },
    data: revenueData,
  },
};
Real-Time Updates
FusionCharts provides dedicated real-time chart types for dashboards that receive continuously changing data. After rendering a real-time chart, you can pass new values to the existing chart instance with the feedData() method.
For example, after configuring and rendering a real-time chart:
chart.feedData("&label=May&value=67000");
feedData() accepts data in FusionCharts’ real-time data format and updates the chart with the new value. The data could come from a WebSocket connection, polling request, or another application event.
How to Choose the Best Chart Library for TypeScript
To be honest, there is no single “best” library here. It completely depends on what you are building. Shipping a quick quarterly report tab is very different from building a real-time trading dashboard with dozens of charts.
To make the right call, focus on your biggest bottleneck:
- Large datasets that run all day: Pick strict TypeScript types and fast rendering. You do not want a library that lags on large datasets or breaks your editor with lazy any types.
- Marketing-facing dashboard: If the dashboard is customer-facing, you’ll want charts that match your UI. Check the theme options, styling controls, and available chart types.
- Live data feeds: Look at how the library updates. You need clean update methods so you can push new data points without re-rendering the whole chart or resetting the DOM.
FusionCharts covers most of these requirements. It comes with a rich chart library of more than 100 chart types plus 2,000+ data-driven maps, fully compatible with React, Vue, or Angular. Plus, it is built natively, not bolted on, and designed to handle large databases and frequent updates without breaking a sweat.
Still, don’t take any library’s marketing at face value. Build a quick test component with your actual data and framework before committing to your stack.
For a broader look at what to consider when choosing a JavaScript charting library, read our guide to interactive charts with JavaScript.
Where Can You Find TypeScript Chart Examples and Documentation?
A few resources worth bookmarking as you build further:
- Chart Gallery: Want to see what’s possible before you commit to a chart type? Browse the chart gallery – it’s got rendered examples across every chart type FusionCharts supports.
- API Documentation: Need something this tutorial didn’t cover? The full charting documentation goes deep on configuration options, APIs, and edge cases.
- Framework Integration Guides: Working in React or Angular specifically? Dedicated walkthroughs for React chart integration and Angular chart integration pick up right where this leaves off. (Using Vue? The getting-started docs cover that integration too.)
- Free Trial & Download: Ready to actually test this in your own project? Grab our FusionCharts free trial: no credit card needed to get started.
- Technical Support: Hit something production-specific that the docs don’t answer? FusionCharts support is there for exactly that.
Frequently Asked Questions
What are TypeScript charts?
TypeScript charts are data visualizations used in TypeScript applications, typically through a JavaScript charting library that provides TypeScript definitions or typed APIs.
What is the best chart library for TypeScript?
The best chart library depends on your application. Consider TypeScript support, available chart types, interactivity, performance, framework integrations, documentation, and licensing. For example, FusionCharts can be used in TypeScript projects and provides TypeScript definitions with its npm package.
How do I add a chart to a TypeScript project?
Install a TypeScript-compatible charting library through npm, import the required modules, define your chart data and configuration, and render the chart in an HTML container or framework component. The tutorial above demonstrates this process with FusionCharts.
Can JavaScript chart libraries be used with TypeScript?
Yes. JavaScript charting libraries can be used in TypeScript projects. Libraries that provide TypeScript definitions offer additional benefits such as type checking and IDE autocomplete.
How do you display a simple bar chart in TypeScript?
With FusionCharts, set the chart type to “bar2d” and provide the chart data and configuration. If you’re following the column chart example in this tutorial, changing “column2d” to “bar2d” switches the visualization to a horizontal bar chart.
Can I use TypeScript charts with React?
Yes. TypeScript can be used with React chart components and wrappers to create typed, reusable chart components. FusionCharts provides a React integration that can be used in React and TypeScript applications.
Final Words
Interactive charts give your data a voice. They help users find exactly what they need, right when they need it, without becoming a data geek. But if your current setup, like TypeScript, has made it harder than it should be to get there, hopefully this blog has your back.
We walked through how to use a charting library to add interactive charts to a TypeScript application, step by step, with real code along the way.
So next time your app needs a dashboard, keep it simple: type your dataset, hand it off to our advanced charting tool, FusionCharts, and let the library handle the rendering.
Ready to build interactive charts in your own TypeScript app? Download FusionCharts and try it in your project.
Have questions about integrating charts or run into an edge case not covered here? Contact us at FusionCharts support; we’re happy to help.