jQuery is a lightweight and fast JavaScript library that simplifies JavaScript programming. For example, with jQuery, event handling, Ajax calls, and HTML DOM manipulation are much easier. Additionally, jQuery allows you to add animations to your web app or website easily with only a few lines of code. Simply put, jQuery wraps common tasks that require long JavaScript code into methods that programmers can easily call with just a few lines of code. Hence, many developers use jQuery in their projects, such as creating a jQuery organizational chart for their web app.
While jQuery itself makes things easy, the general perception is that creating a jQuery organizational chart is a difficult process. However, it’s actually not as difficult as you think, given that you’re using FusionCharts, the leading JavaScript charting library.
In this article, we’ll discuss what organizational charts are and show you how you can make jQuery organizational charts quickly and easily.
Table of Contents
What Are Organizational Charts?
An organizational chart/org chart is a diagram that visually represents an organization’s internal structure. It describes the responsibilities, roles, and designations of employees within an organization.
An organizational chart consists of boxes containing employees’ names, photos, email addresses, and designations. Straight or connector lines link these boxes together, forming a hierarchy. Hence, organizational charts are also known as hierarchy charts. For example, in a hierarchical org chart, a marketing manager will fall below the marketing director. Some other organizational charts include matrix charts, flat organizational charts, and divisional organizational charts.
A company can have a broad organizational chart depicting the hierarchy of the overall company, or there can be several organizational charts for each department. Organizational charts allow employees to see how their roles fit in the context of the overall structure of the company. They also help create a clear reporting structure. Additionally, organizational charts facilitate collaboration and improve communication. Not to mention, these charts help employees manage their workload better.
However, organizations can only reap the benefits of an organizational chart if they build and manage it properly. We have discussed how you can easily create meaningful jQuery organizational charts next.
What Is The Best Way to Create A jQuery Organizational Chart?
While you’ll find many options to create a jQuery organizational chart, the best and most efficient way is to use FusionCharts. FusionCharts is a comprehensive JavaScript charting library that allows you to build robust charts and graphs. It lets you create more than 100 different types of charts, including organizational charts, station map charts, and network visualization. FusionCharts also comes with over 2000 choropleth maps covering countries and cities. Additionally, it comes with several pre-built dashboards that you can use to track different metrics and KPIs.
The visualizations you create with FusionCharts are responsive, sleek, and visually appealing. Moreover, these visualizations are capable of updating as the data variables change. Another great thing about FusionCharts is that it can efficiently handle big data.
When it comes to jQuery charts, FusionCharts offer a jQuery plugin that is compatible with both Bootstrap and jQuery UI. With the jQuery plugin for FusionCharts, you can easily create over 150 different charts, including organizational charts. It has event support for keyboard, mouse, and more, which allows you to add charts and graphs at any time in your web apps. The plugin is fully open source, and a team of highly professional developers maintains and manages it to ensure it works efficiently.
What Are The Key Features of FusionCharts’ jQuery Plugin?
Some key features of FusionCharts’ jQuery plugin include:
- Any reference to the plugin won’t conflict with existing JavaScript, HTML, and CSS because all references are unique.
- The plugin comes with multiple rendering options. You can choose to render a chart at the beginning of an HTML container or at the end. You can also replace the content of the container with a chart.
- The plugin allows you to update the chart data, chart type, or chart size of an existing chart at run-time. It also lets you update the chart’s root properties quickly. Hence, you can easily change the title of the chart, theme colors, number formatting, etc.
If you want to learn more about FusionCharts’ jQuery plugin, check out this article.
How To Create A jQuery Organizational Chart With FusionCharts?
FusionCharts offers jQuery drag node charts that you can use to create hierarchical charts or organizational charts. The drag note chart is essentially a special type of chart that uses nodes of different shapes, such as rectangles, circles, or polygons, depending on your requirements. These nodes represent data sets or employee information in the case of an organizational chart. In addition to nodes, you can also add connectors and labels and edit them as well. The purpose of connectors is to link different nodes, while text labels help identify nodes and connectors. When you change the positions of the node, you can send the updated positions back to the server for processing.
Below is an example jQuery code for creating an organizational chart:
$("#chart-container").insertFusionCharts({
type: "dragnode",
width: "100%",
height: "100%",
dataFormat: "json",
dataSource: {
chart: {
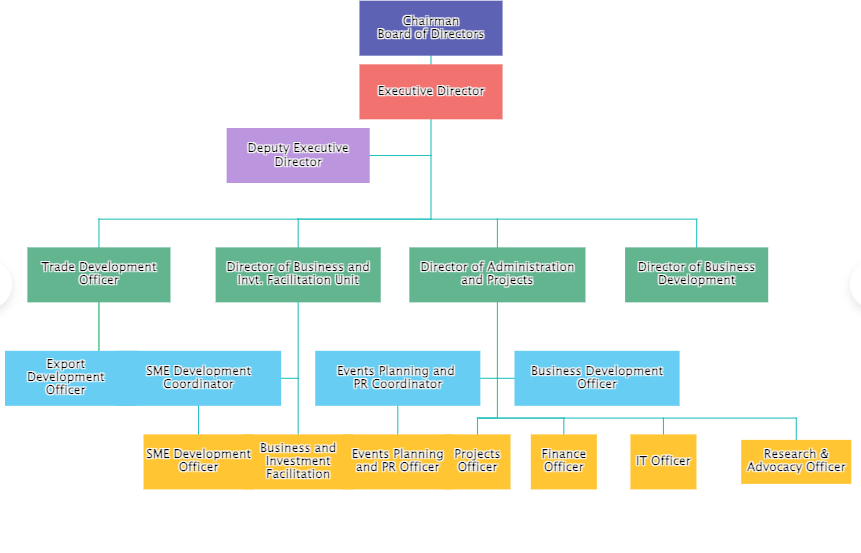
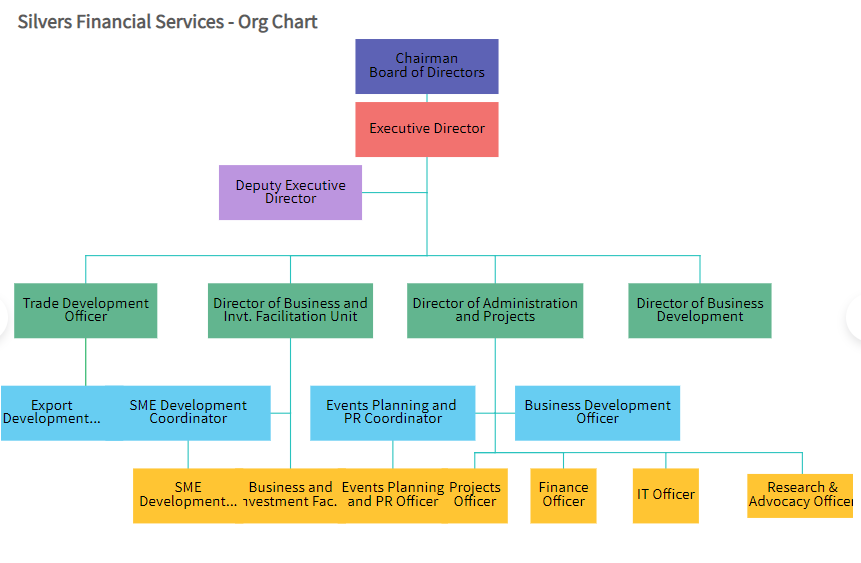
caption: "Silvers Financial Services - Org Chart",
captionalignment: "left",
viewmode: "1",
showformbtn: "0",
theme: "fusion",
divlinealpha: "0"
},
dataset: [
{
data: [
{
id: "01",
label: "Chairman{br}Board of Directors",
color: "#5D62B5",
x: "60",
y: "680",
shape: "rectangle",
width: "130",
height: "50"
},
{
id: "01.01",
label: "Executive Director",
color: "#F2726F",
x: "60",
y: "600",
shape: "rectangle",
width: "130",
height: "50"
},
{
id: "01.02",
label: "",
x: "60",
y: "520",
alpha: "0",
shape: "circle",
radius: "5"
},
{
id: "01.03",
label: "Deputy Executive{br}Director",
color: "#BC95DF",
x: "40",
y: "520",
shape: "rectangle",
width: "130",
height: "50"
},
{
id: "02",
label: "",
x: "60",
y: "440",
alpha: "0",
shape: "circle",
radius: "5"
},
{
id: "02.01",
label: "",
x: "40",
y: "440",
alpha: "0",
shape: "circle",
radius: "5"
},
{
id: "02.01.01",
label: "Director of Business and{br} Invt. Facilitation Unit",
color: "#62B58F",
x: "40",
y: "370",
shape: "rectangle",
width: "150",
height: "50"
},
{
id: "02.02",
label: "",
x: "10",
y: "440",
alpha: "0",
shape: "circle",
radius: "5"
},
{
id: "02.02.01",
label: "Trade Development{br}Officer",
color: "#62B58F",
x: "10",
y: "370",
shape: "rectangle",
width: "130",
height: "50"
},
{
id: "02.03",
label: "",
x: "70",
y: "440",
alpha: "0",
shape: "circle",
radius: "5"
},
{
id: "02.03.01",
label: "Director of Administration{br}and Projects",
color: "#62B58F",
x: "70",
y: "370",
shape: "rectangle",
width: "160",
height: "50"
},
{
id: "02.04",
label: "",
x: "100",
y: "440",
alpha: "0",
shape: "circle",
radius: "5"
},
{
id: "02.04.01",
label: "Director of Business{br}Development",
color: "#62B58F",
x: "100",
y: "370",
shape: "rectangle",
width: "130",
height: "50"
},
{
id: "03",
label: "",
x: "10",
y: "270",
alpha: "0",
shape: "circle",
radius: "5"
},
{
id: "03.01",
label: "Export{br}Development{br}Officer",
color: "#67CDF2",
x: "5",
y: "240",
shape: "rectangle",
width: "130",
height: "50"
},
{
id: "03.02",
label: "",
x: "40",
y: "240",
alpha: "0",
shape: "circle",
radius: "5"
},
{
id: "03.02.01",
label: "SME Development{br}Coordinator",
color: "#67CDF2",
x: "25",
y: "240",
shape: "rectangle",
width: "150",
height: "50"
},
{
id: "03.02.02",
label: "Business and{br}Investment Facilitation",
color: "#FFC533",
x: "40",
y: "135",
shape: "rectangle",
width: "100",
height: "50"
},
{
id: "03.03",
label: "",
x: "70",
y: "240",
alpha: "0",
shape: "circle",
radius: "5"
},
{
id: "03.03.01",
label: "Events Planning and {br}PR Coordinator",
color: "#67CDF2",
x: "55",
y: "240",
shape: "rectangle",
width: "150",
height: "50"
},
{
id: "03.03.02",
label: "Business Development{br}Officer",
color: "#67CDF2",
x: "85",
y: "240",
shape: "rectangle",
width: "150",
height: "50"
},
{
id: "03.04",
label: "",
x: "70",
y: "190",
alpha: "0",
shape: "circle",
radius: "5"
},
{
id: "03.05",
label: "",
x: "67",
y: "190",
alpha: "0",
shape: "circle",
radius: "5"
},
{
id: "03.05.01",
label: "Projects Officer",
color: "#FFC533",
x: "67",
y: "135",
shape: "rectangle",
width: "60",
height: "50"
},
{
id: "03.06",
label: "",
x: "80",
y: "190",
alpha: "0",
shape: "circle",
radius: "5"
},
{
id: "03.06.01",
label: "Finance Officer",
color: "#FFC533",
x: "80",
y: "135",
shape: "rectangle",
width: "60",
height: "50"
},
{
id: "03.07",
label: "",
x: "95",
y: "190",
alpha: "0",
shape: "circle",
radius: "5"
},
{
id: "03.07.01",
label: "IT Officer",
color: "#FFC533",
x: "95",
y: "135",
shape: "rectangle",
width: "60",
height: "50"
},
{
id: "03.08",
label: "",
x: "115",
y: "190",
alpha: "0",
shape: "circle",
radius: "5"
},
{
id: "03.08.01",
label: "Research & Advocacy Officer",
color: "#FFC533",
x: "115",
y: "135",
shape: "rectangle",
width: "100",
height: "40"
},
{
id: "03.09",
label: "SME Development{br}Officer",
color: "#FFC533",
x: "25",
y: "135",
shape: "rectangle",
width: "100",
height: "50"
},
{
id: "03.10",
label: "Events Planning{br} and PR Officer",
color: "#FFC533",
x: "55",
y: "135",
shape: "rectangle",
width: "100",
height: "50"
}
]
}
],
connectors: [
{
color: "#ffffff",
connector: [
{
from: "01",
to: "01.01",
color: "#29C3BE",
strength: "1",
arrowatstart: "0",
arrowatend: "0",
alpha: "100"
},
{
from: "01.01",
to: "01.02",
color: "#29C3BE",
strength: "1",
arrowatstart: "0",
arrowatend: "0",
alpha: "100"
},
{
from: "01.02",
to: "01.03",
color: "#29C3BE",
strength: "1",
arrowatstart: "0",
arrowatend: "0",
alpha: "100"
},
{
from: "01.02",
to: "02",
color: "#29C3BE",
strength: "1",
arrowatstart: "0",
arrowatend: "0",
alpha: "100"
},
{
from: "02",
to: "02.01",
color: "#29C3BE",
strength: "1",
arrowatstart: "0",
arrowatend: "0",
alpha: "100"
},
{
from: "02.01",
to: "02.01.01",
color: "#29C3BE",
strength: "1",
arrowatstart: "0",
arrowatend: "0",
alpha: "100"
},
{
from: "02.01",
to: "02.02",
color: "#29C3BE",
strength: "1",
arrowatstart: "0",
arrowatend: "0",
alpha: "100"
},
{
from: "02.02",
to: "02.02.01",
color: "#29C3BE",
strength: "1",
arrowatstart: "0",
arrowatend: "0",
alpha: "100"
},
{
from: "02.01",
to: "02.03",
color: "#29C3BE",
strength: "1",
arrowatstart: "0",
arrowatend: "0",
alpha: "100"
},
{
from: "02.03",
to: "02.03.01",
color: "#29C3BE",
strength: "1",
arrowatstart: "0",
arrowatend: "0",
alpha: "100"
},
{
from: "02.03",
to: "02.04",
color: "#29C3BE",
strength: "1",
arrowatstart: "0",
arrowatend: "0",
alpha: "100"
},
{
from: "02.04",
to: "02.04.01",
color: "#29C3BE",
strength: "1",
arrowatstart: "0",
arrowatend: "0",
alpha: "100"
},
{
from: "02.02.01",
to: "03",
color: "#1aaf5d",
strength: "1",
arrowatstart: "0",
arrowatend: "0",
alpha: "100"
},
{
from: "03",
to: "03.01",
color: "#29C3BE",
strength: "1",
arrowatstart: "0",
arrowatend: "0",
alpha: "100"
},
{
from: "02.01.01",
to: "03.02",
color: "#29C3BE",
strength: "1",
arrowatstart: "0",
arrowatend: "0",
alpha: "100"
},
{
from: "03.02",
to: "03.02.01",
color: "#29C3BE",
strength: "1",
arrowatstart: "0",
arrowatend: "0",
alpha: "100"
},
{
from: "03.02",
to: "03.02.02",
color: "#29C3BE",
strength: "1",
arrowatstart: "0",
arrowatend: "0",
alpha: "100"
},
{
from: "02.03.01",
to: "03.03",
color: "#29C3BE",
strength: "1",
arrowatstart: "0",
arrowatend: "0",
alpha: "100"
},
{
from: "03.03",
to: "03.03.01",
color: "#29C3BE",
strength: "1",
arrowatstart: "0",
arrowatend: "0",
alpha: "100"
},
{
from: "03.03",
to: "03.03.02",
color: "#29C3BE",
strength: "1",
arrowatstart: "0",
arrowatend: "0",
alpha: "100"
},
{
from: "03.03",
to: "03.04",
color: "#29C3BE",
strength: "1",
arrowatstart: "0",
arrowatend: "0",
alpha: "100"
},
{
from: "03.04",
to: "03.05",
color: "#29C3BE",
strength: "1",
arrowatstart: "0",
arrowatend: "0",
alpha: "100"
},
{
from: "03.05",
to: "03.06",
color: "#29C3BE",
strength: "1",
arrowatstart: "0",
arrowatend: "0",
alpha: "100"
},
{
from: "03.05",
to: "03.05.01",
color: "#29C3BE",
strength: "1",
arrowatstart: "0",
arrowatend: "0",
alpha: "100"
},
{
from: "03.05",
to: "03.06",
color: "#29C3BE",
strength: "1",
arrowatstart: "0",
arrowatend: "0",
alpha: "100"
},
{
from: "03.06",
to: "03.06.01",
color: "#29C3BE",
strength: "1",
arrowatstart: "0",
arrowatend: "0",
alpha: "100"
},
{
from: "03.06",
to: "03.07",
color: "#29C3BE",
strength: "1",
arrowatstart: "0",
arrowatend: "0",
alpha: "100"
},
{
from: "03.07",
to: "03.07.01",
color: "#29C3BE",
strength: "1",
arrowatstart: "0",
arrowatend: "0",
alpha: "100"
},
{
from: "03.07",
to: "03.08",
color: "#29C3BE",
strength: "1",
arrowatstart: "0",
arrowatend: "0",
alpha: "100"
},
{
from: "03.08",
to: "03.08.01",
color: "#29C3BE",
strength: "1",
arrowatstart: "0",
arrowatend: "0",
alpha: "100"
},
{
from: "03.02.01",
to: "03.09",
color: "#29C3BE",
strength: "1",
arrowatstart: "0",
arrowatend: "0",
alpha: "100"
},
{
from: "03.03.01",
to: "03.10",
color: "#29C3BE",
strength: "1",
arrowatstart: "0",
arrowatend: "0",
alpha: "100"
}
]
}
]
}
});The code above will create the following organizational chart:
Which Other jQuery Charts Can I Make With FusionCharts?
In addition to organizational charts, the FusionCharts’ jQuery plugin comes with more than 150 pre-built charts. The plugin supports responsive and interactive charts, allowing you to zoom in and out and pan. You can also add drill-downs, show and hide data series in column charts, and more. Moreover, all these charts and graphs can efficiently handle millions of data points without any performance issues. Additionally, the plugin also supports real-time updates and allows you to export dashboards and charts. Any chart or dashboard you make with the jQuery plugin for FusionCharts is responsive on all devices.
Some of the common charts and graphs that you can make with FusionCharts’ jQuery plugin include:
Line and Area Charts
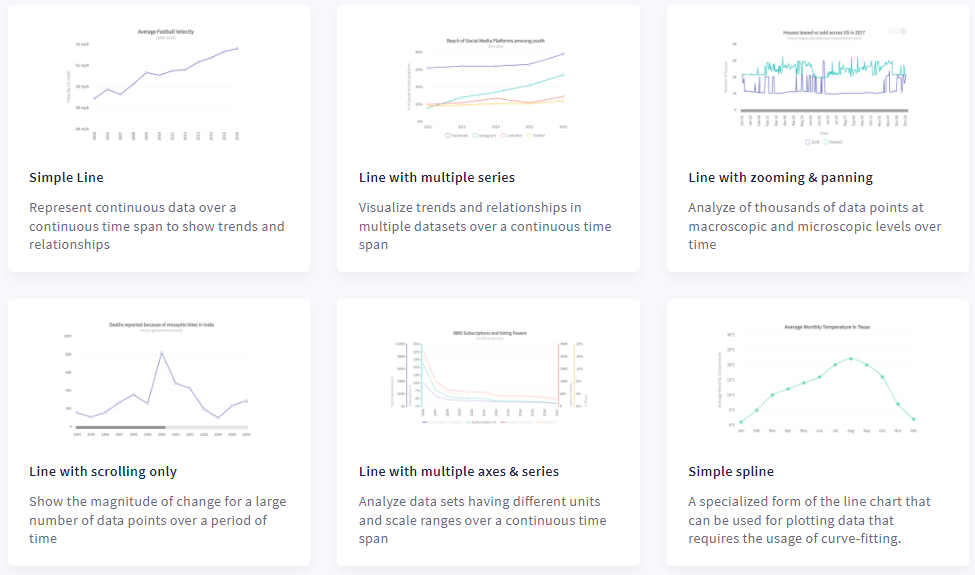
Line charts allow you to depict continuous data over time. For instance, you can represent fluctuations in hourly temperature, foreign currency rates, daily earnings, etc. using line charts. Area charts are helpful in understanding trends and performances over time.
Column and Bar Charts
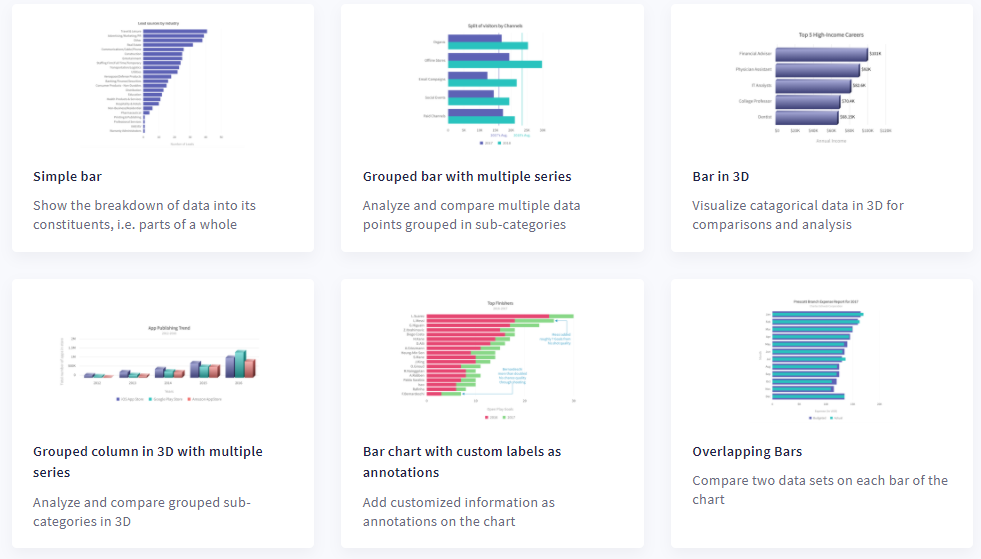
Column charts let you compare numeric values or data over a period of time. Bar charts are great for representing quantitative information.
Pie and Donut Charts
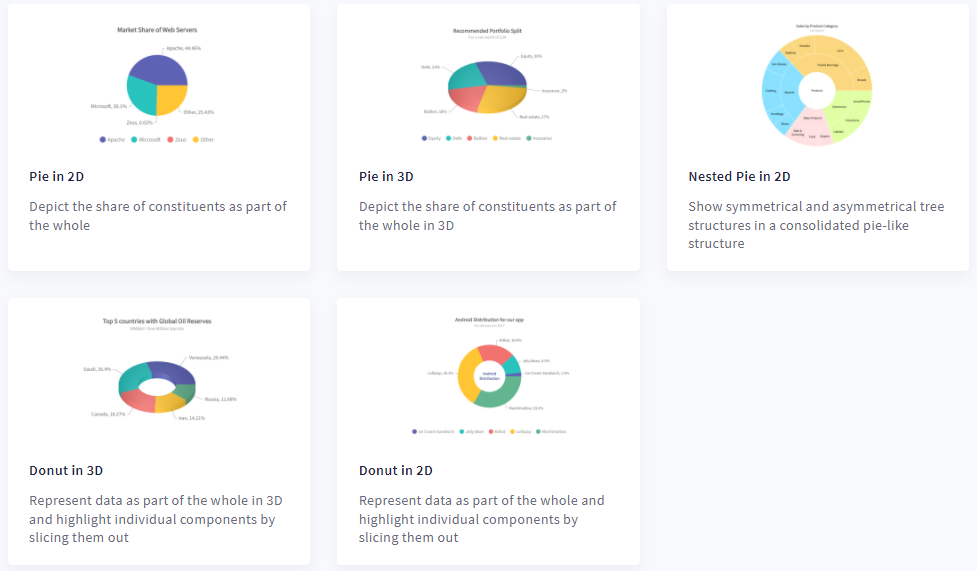
You can use a pie chart when you want to represent the percentages of a whole. A Donut chart is like a pie chart, but it has a blank space at the center where you can display key points related to the data.