Heatmaps are an excellent tool for visualizing numerical and categorical data. This is necessary because, if you have a large dataset, simply inspecting its data values may not be enough to make sense of it. Heatmaps assist in resolving this issue by using colors to represent data in a 2D table format. Values that are close together are assigned similar colors, and a significant change in color indicates a significant variation in data values. As a result, heatmaps assist data scientists in understanding which attributes or features, as well as high or low values, correspond to different categories.
Before running data through an automated learning system for machine learning and data science, it is critical to visualize and inspect the data. Plotting and visualization tools that are automated provide critical insights into data. FusionCharts is a comprehensive library of 100+ data charts and 2000+ maps that can be easily integrated into your web and mobile applications for all modern devices.
In this post, we’ll take a look into making an app that generates a heatmap from the well-known Iris machine learning dataset, which is available at the UCI Machine Learning Repository. We’ll start by extracting a summary of this dataset and then display it with a heatmap and see how a Data Visualization Tool provides useful information that allows us to distinguish between different types of data. Once you’re familiar with how these tools work and how to use them, you’ll be able to replicate this tutorial on your own!
Table of Contents
The Iris Dataset
Scientists frequently use the Iris dataset to demonstrate and evaluate a machine learning algorithm. It has four attributes, also represented as columns. These are the Sepal length, Sepal width, Petal length, and Petal width.
There are also three classes present in this dataset that represent the flower species: Iris Setosa, Iris Versicolour, and Iris Virginica.
The goal here is to identify the species of a flower based on its attributes. To do this, we extract the mean of each attribute for a class and plot it as a heatmap. The heatmap shows us how we can differentiate between different categories based on this simple statistic. Similarly, you can create a heatmap for the median, minimum, or maximum values. You can also create a bigger heatmap that displays the entire unprocessed or raw dataset.
The HeatMap of the Iris Dataset
Here is the heatmap for the mean statistic of the Iris dataset:
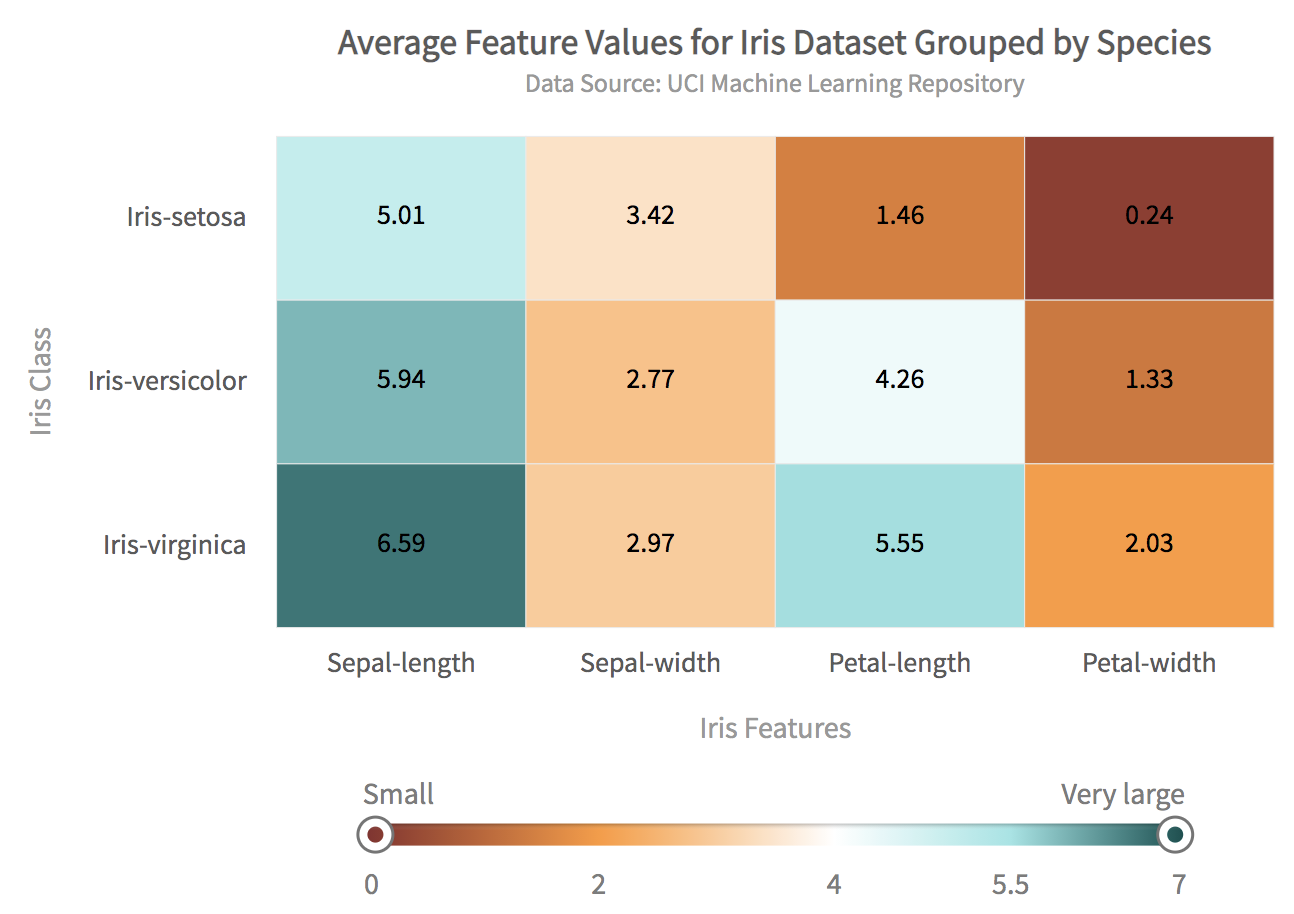
The heatmap has many features. For example:
- Varying colors in the heatmap depict the differences in various features corresponding to different classes, for example, the sepal length for multiple categories. It also shows that sepal lengths tend to be much bigger than petal lengths.
- Hovering the mouse over any cell shows the details of that cell. These details are configurable.
- A gradient legend at the bottom of the table shows how values vary with different colors.
- You can configure everything from the title and subtitle to the axis labels.
Let’s get started on building an app that displays a heatmap.
Project Setup with Webpack
To set up the project using webpack, first create a new directory for the project. I chose to call my directory heatMaps. Change to your project directory and follow these steps:
Step 1: Install Webpack and FusionCharts
Type the following at the console:
npm i -D webpack-dev-server html-webpack-plugin path webpack-cli fusionchartsStep 2: Make src and dist Directories and Create the index.js
Enter the following commands at the console:
mkdir src
mkdir dist
touch src/index.js
The entire code for the data conversion and chart rendering goes into the index.js file.
Step 3: Create the webpack.config.js
In the main project directory create a file called webpack.config.js and enter the following code:
// webpack.config.js
const HtmlWebPackPlugin = require( 'html-webpack-plugin' );
const path = require( 'path' );
module.exports = {
   context: __dirname,
   entry: './src/index.js',
   output: {
      path: path.resolve( __dirname, 'dist' ),
      filename: 'main.js',
   },

   plugins: [
      new HtmlWebPackPlugin()
   ],
   devServer: {
       headers: {
           "Access-Control-Allow-Origin": "*",
           "Access-Control-Allow-Methods": "GET, POST, PUT, DELETE, PATCH, OPTIONS",
           "Access-Control-Allow-Headers": "X-Requested-With, content-type, Authorization"
         },
       proxy: {
         '/mlRepo': {
            target: 'https://archive.ics.uci.edu',
            pathRewrite: { '^/mlRepo': '/ml/machine-learning-databases/iris/iris.data' },
            changeOrigin: true,
         },
       },

     }
};
This configuration file enables CORS for the UCI machine learning repository website and allows us to download the Iris dataset from there.
Import FusionCharts Library
In the index.js file add the following lines to import the FusionCharts libraries:
// Include the core fusioncharts file from core
import FusionCharts from 'fusioncharts/core';

// Include the chart from viz folder
// E.g. - import ChartType from fusioncharts/viz/[ChartType]
import heatmap from 'fusioncharts/viz/heatmap';

// Include the fusion theme
import FusionTheme from 'fusioncharts/themes/es/fusioncharts.theme.fusion';
We also need a div tag to create an area on the HTML page for the heatmap. You can add it using this code:
//Create a div tag for the container for heatmaps
const myDiv = document.createElement('div');
myDiv.id = 'chart-container';
document.body.appendChild(myDiv)
The main() Function
This is the main function for rendering the HTML page. You can add it to the index.js file.
//main function for rendering the html page
async function main() {
    //Get the data
    let response = await fetch('/mlRepo');
    let data = await response.text();
    if (response.ok){
        renderPage(data);
    }
    else {
        alert('Error reading data from ML repository');
    }
}
The main() function reads the data file from the UCI Machine Learning Repository and calls the renderPage() function. The renderPage() function contains function calls to convert the CSV text to the required format for a heatmap and render it. Here is the renderPage() function:
//renders the html page when passed data as csv-text
function renderPage(csvText){
    var irisCols = ['Sepal-length','Sepal-width','Petal-length','Petal-width','Class'];
    var matrix = csvToMatrix(csvText,',');
    var avg = getAverage(matrix);
    var dataset = constructDatasetJson(avg.avgMatrix,irisCols,avg.classes);
    var jsonArr = constructDataSourceJson(dataset,irisCols,avg.classes);
    renderChart(jsonArr);
}
Convert the Data to JSON
A heatmap requires you to input data as a JSON object. You should follow these steps to convert the CSV text to the required JSON format:
Convert the CSV to Matrix and Compute Averages
Here are three functions that you need to add to the index.js file. The first function csvToMatrix() converts the CSV text to matrix form. The unique() function is a helper function for finding unique values of a category. The third function getAverage() computes the average of each attribute for each category.
//convert csv text to matrix
function csvToMatrix(csvText,sep=','){
    var matrix = [];
    var rows = csvText.split("\n");
    for(var i=0;i<rows.length;i++){
        var cols = rows[i].split(sep);
        if (cols.length > 1)
        matrix.push(cols);
    }
    return matrix;
}

//helper function to get unique items in array
function unique(value, index, self){
    return self.indexOf(value) === index;
}

//compute the average of each column
function getAverage(matrix){
    var avgMatrix = [];
    var rows = matrix.length;
    var cols = matrix[0].length;
    //find the unique classes (iris species)
    var classes = matrix.map(function(value,index) {return value[cols-1];});
    classes = classes.filter(unique);
    //JSON for dataset
    var dataset = [];
    //for each iris species/class
    for (var k=0;k<classes.length;++k)
    {
        var className = classes[k];
        var rowData = [];
        //get the subset matrix for class k
        var subset = matrix.filter(r=>r[cols-1].match(className));
        //for each column
        for (var j=0;j<cols-1;++j)
        {
            //collect the average by moving along each row
            var avg = 0;
            for (var i=0;i<subset.length;++i)
                avg += parseFloat(subset[i][j]);
            avg = avg/subset.length;
            rowData.push(avg);
        }
        avgMatrix.push(rowData);
    }
    return {avgMatrix,classes};
}
Construct the Dataset JSON Key
Now it’s time to construct the JSON object for the ‘dataset’ key. Add the following function to the index.js file:
//returns JSON text for 'dataset' key
function constructDatasetJson(matrix,colheads,rowHeads){

    var rows = matrix.length;
    var cols = matrix[0].length;

    //JSON for data
    var data = [];
    for (var i=0;i<rows;++i)
    {
        for (var j=0;j<cols;++j)
        {
            var obj = {};
            obj['rowid'] = rowHeads[i];
            obj['columnid'] = colheads[j];
            obj['value'] = matrix[i][j];
            data.push(obj);
        }
    }
    //JSON for dataset
    var dataset = [];
    dataset.push({data:data});
    return dataset;
}
Construct the Datasource JSON Key
Now you can construct the ‘datasource’ JSON key by adding the following function to the index.js file:
//constructs JSON text for 'dataSource' key
function constructDataSourceJson(dataset,colheads,rowHeads){
    var colorRange =  {
        gradient: "1",
        minvalue: "0",
        code: "#862d2d",
        startlabel: "Small",
        endlabel: "Very large",
        color: [
          {
            code: "#ff9933",
            maxvalue: "2"
          },
          {
            code: "#FFFFFF",
            maxvalue: "4"
          },
          {
            code: "#9ae5e5",
            maxvalue: "5.5"
          },
          {
            code: "#004d4d",
            maxvalue: "7"
          }
        ]
  };

  var JsonArr = {chart: {
        caption: "Average Feature Values for Iris Dataset Grouped by Species",
        subcaption: "Data Source: UCI Machine Learning Repository",
        xAxisName: "Iris Features",
        yAxisName: "Iris Class",
        showvalues: "1",
        plottooltext:
         "<div><b>$rowLabel</b><br/>$columnLabel Average Value: <b>$dataValue</b></div>",
        theme: "fusion"
    }, dataset,colorrange:colorRange};
    return JsonArr;
}
Render the Heatmap
Finally, paste the following function in index.js to render the heatmap:
// Draw the chart
function renderChart(dataSrc){
    FusionCharts.addDep(heatmap);
    FusionCharts.addDep(FusionTheme);
    //Chart Configurations
    const chartConfig = {
        type: 'heatmap',
        renderAt: 'chart-container',
        width: '50%',
        height: '500',
        dataFormat: 'json',
        dataSource: dataSrc
    }
    //Create an Instance with chart options and render the chart
    var chartInstance = new FusionCharts(chartConfig);
    chartInstance.render();
}
Run the App
Don’t forget to call the main() function at the end of the index.js file.
You can run the webpack server by typing at the command line:
npx webpack serve --mode=developmentLoad the app in your browser using localhost:8080.
Are There More Ways to Present Machine Learning Data?
Heatmaps are not the only method of presenting values of a machine learning dataset. You can explore FusionCharts to create beautiful visualizations using many different charts, maps, and plots. Start your free trial today and impress your colleagues and clients with professional and effective data presentations.
You can download the entire source code for this app by clicking this link.
Happy coding!
