Heat and Tree Maps
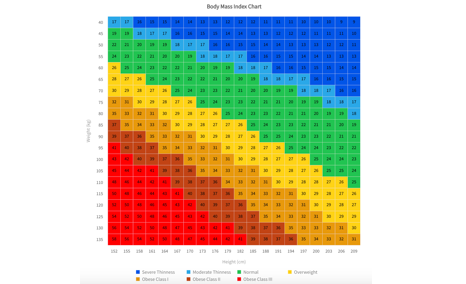
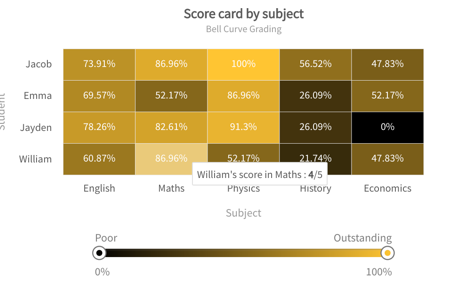
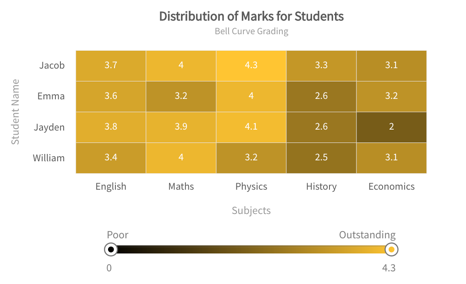
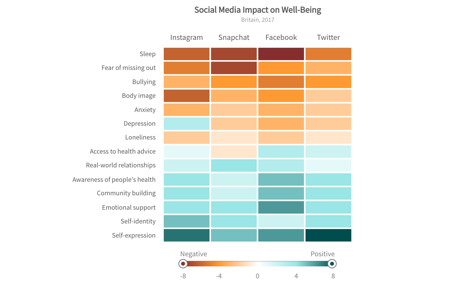
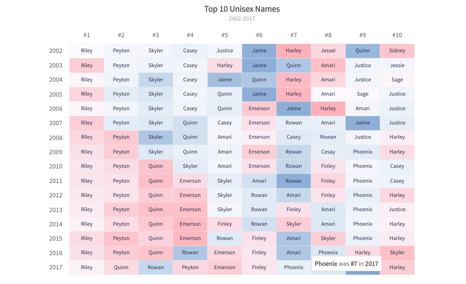
A heat map is a two-dimensional representation of information with the help of colors. Heat maps can help the user visualize simple or complex information. Heat maps are used in many areas such as defense, marketing and understanding consumer behavior. Heat maps can be useful in several activities such as understanding election results in a region or user behavior on a website. In the case of election results, distinct colors generated by the map can indicate the regions or seats won by different parties. Similarly, in the case of user behavior on a website, distinct colors can indicate both frequent and infrequent clicks on the website. Therefore, this makes a heat map a useful tool for data analysis.
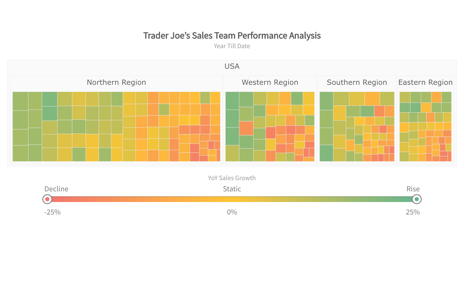
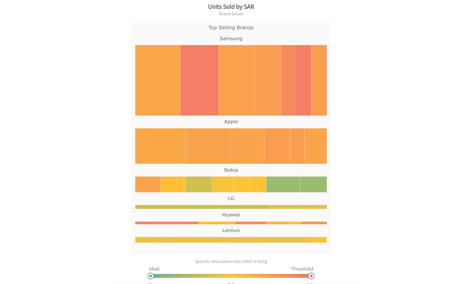
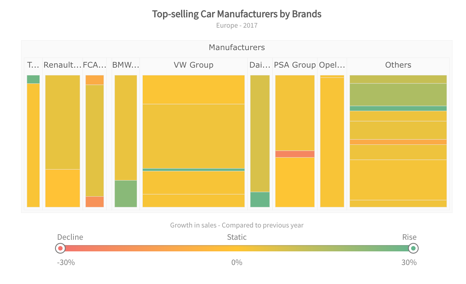
Treemaps are ideal for displaying large amounts of hierarchically structured (tree-structured) data. The space in the visualization is split up into rectangles that are sized and ordered by a quantitative variable.The levels in the hierarchy of the treemap are visualized as rectangles containing other rectangles. Each set of rectangles on the same level in the hierarchy represents a column or an expression in a data table. Each individual rectangle on a level in the hierarchy represents a category in a column. For example, a rectangle representing a continent may contain several rectangles representing countries in that continent. Each rectangle representing a country may in turn contain rectangles representing cities in these countries.
