A data visualization tool creates a graphic representation of data. This not only gives important insights into correlations between variables, long-term data trends, and short-term fluctuations but also helps compare various key performance indicators over time. Managers, CEOs, and executives now use business dashboards to regularly monitor and track various company metrics and stay up-to-date with the latest data and figures pertaining to sales, net profits, and employee performance.
There are many data visualization libraries available in the market today. If you are looking to develop your next business application with data visualizations integrated within it, then we have the perfect solution for you. FusionCharts is a charting and graphing library that not only meets all your requirements but is available at reasonable and affordable prices.
To help you get started, we have compiled an ultimate checklist of 10 items, which will convince you why FusionCharts is the best Highcharts alternative. If you use FusionCharts once, you’ll never give another graphing and charting solution a second glance.
Table of Contents
1. Does the Highcharts Alternative Have a Flexible Pricing Structure to Meet Your Budget?
One important consideration when buying a charting and graphing library is the cost and pricing. At FusionCharts we believe in high quality solutions at very reasonable prices. Whether you’re a startup or a large corporation, our pricing is
adjustable, and it is determined by your budget and needs. You can buy a complete graphing package at very reasonable prices. The best thing is that you can download a trial version for free and test it out while you are still in the development phase.
2. Does FusionCharts-the Highcharts Alternative Support Collaborative Editing?
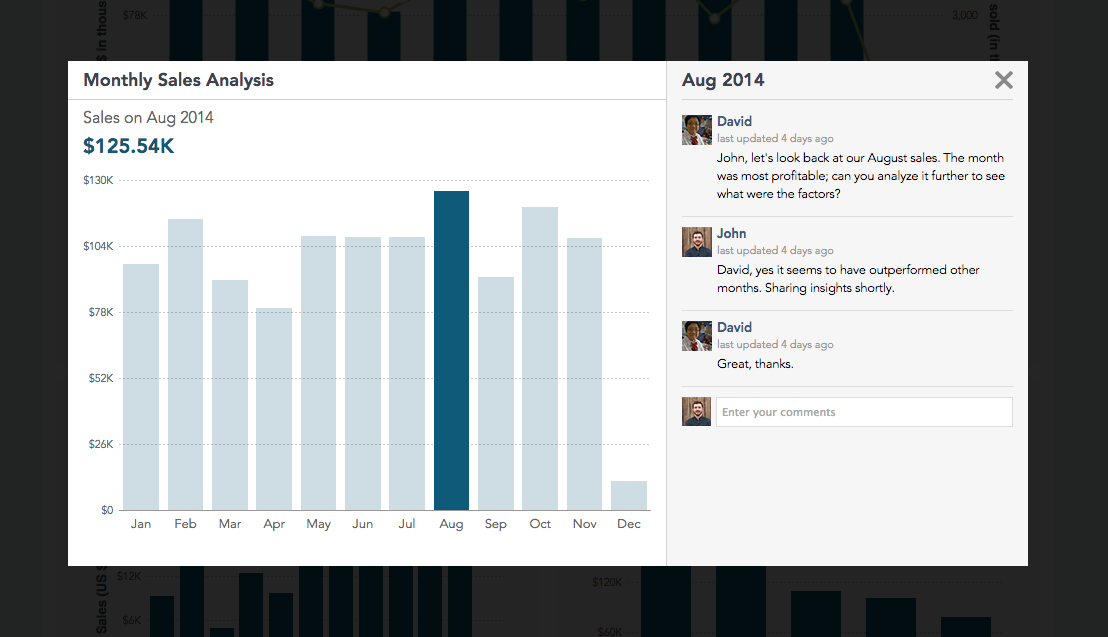
FusionCharts supports collaborative editing to let multiple teams and people discuss and deliberate on the various aspects of their data. With FusionCharts, users can comment right there on a chart and get immediate responses from their colleagues. This makes the FusionCharts interface very similar to a social media platform with focused discussions on the trends and fluctuations depicted by the charts, graphs, or dashboards.
3. Is FusionCharts a Highcharts Alternative that Allows Live Streaming Charts?
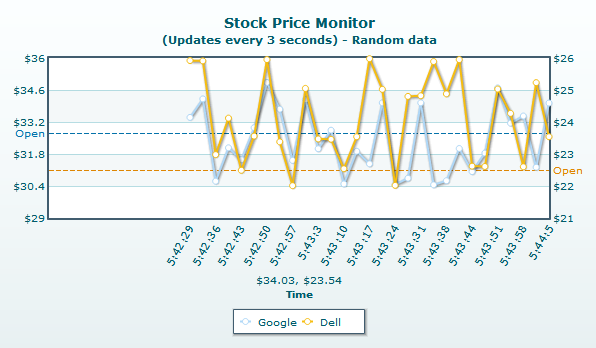
Yes, absolutely! FusionCharts supports live streaming charts that update themselves in real-time. With this feature, the chart automatically refreshes after user-specified intervals of time. Data is fetched from the server automatically and the chart is rendered with the latest data points.
4. Which Highcharts Alternative Has Drill-Down Charts?
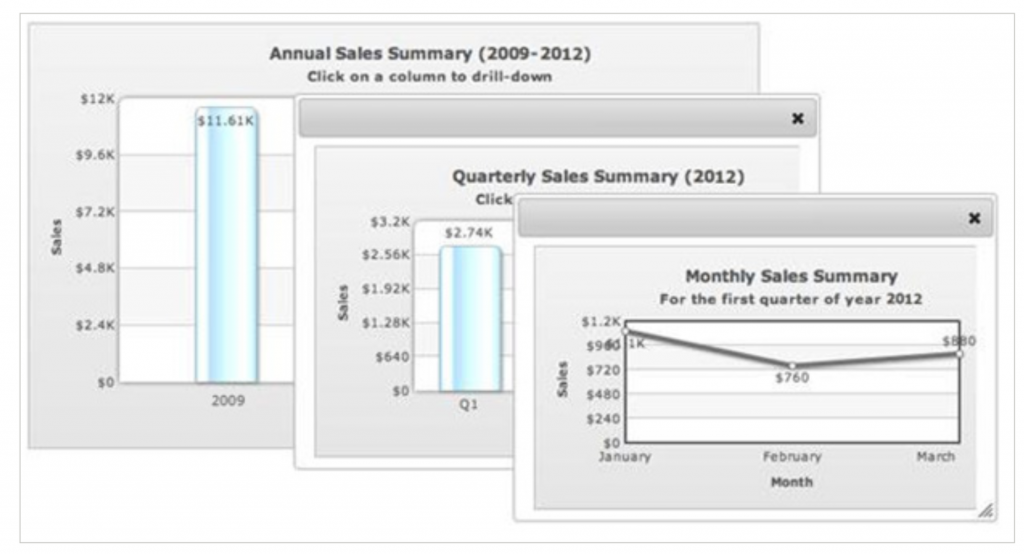
FusionCharts provides full support for drill-down charts. With this feature, each data value acts as a hot spot and you can choose to either stick to default functionality or customize its behavior. A new descendent chart can be opened in a new window or more information can be displayed in the same window using tooltips. FusionCharts allows you to specify as many levels of drill-downs as you require. This option allows users to have not only a more holistic view of data but also look at all the minute details within.
5. Is FusionCharts a Highcharts Alternative for Domain-Specific Charts?
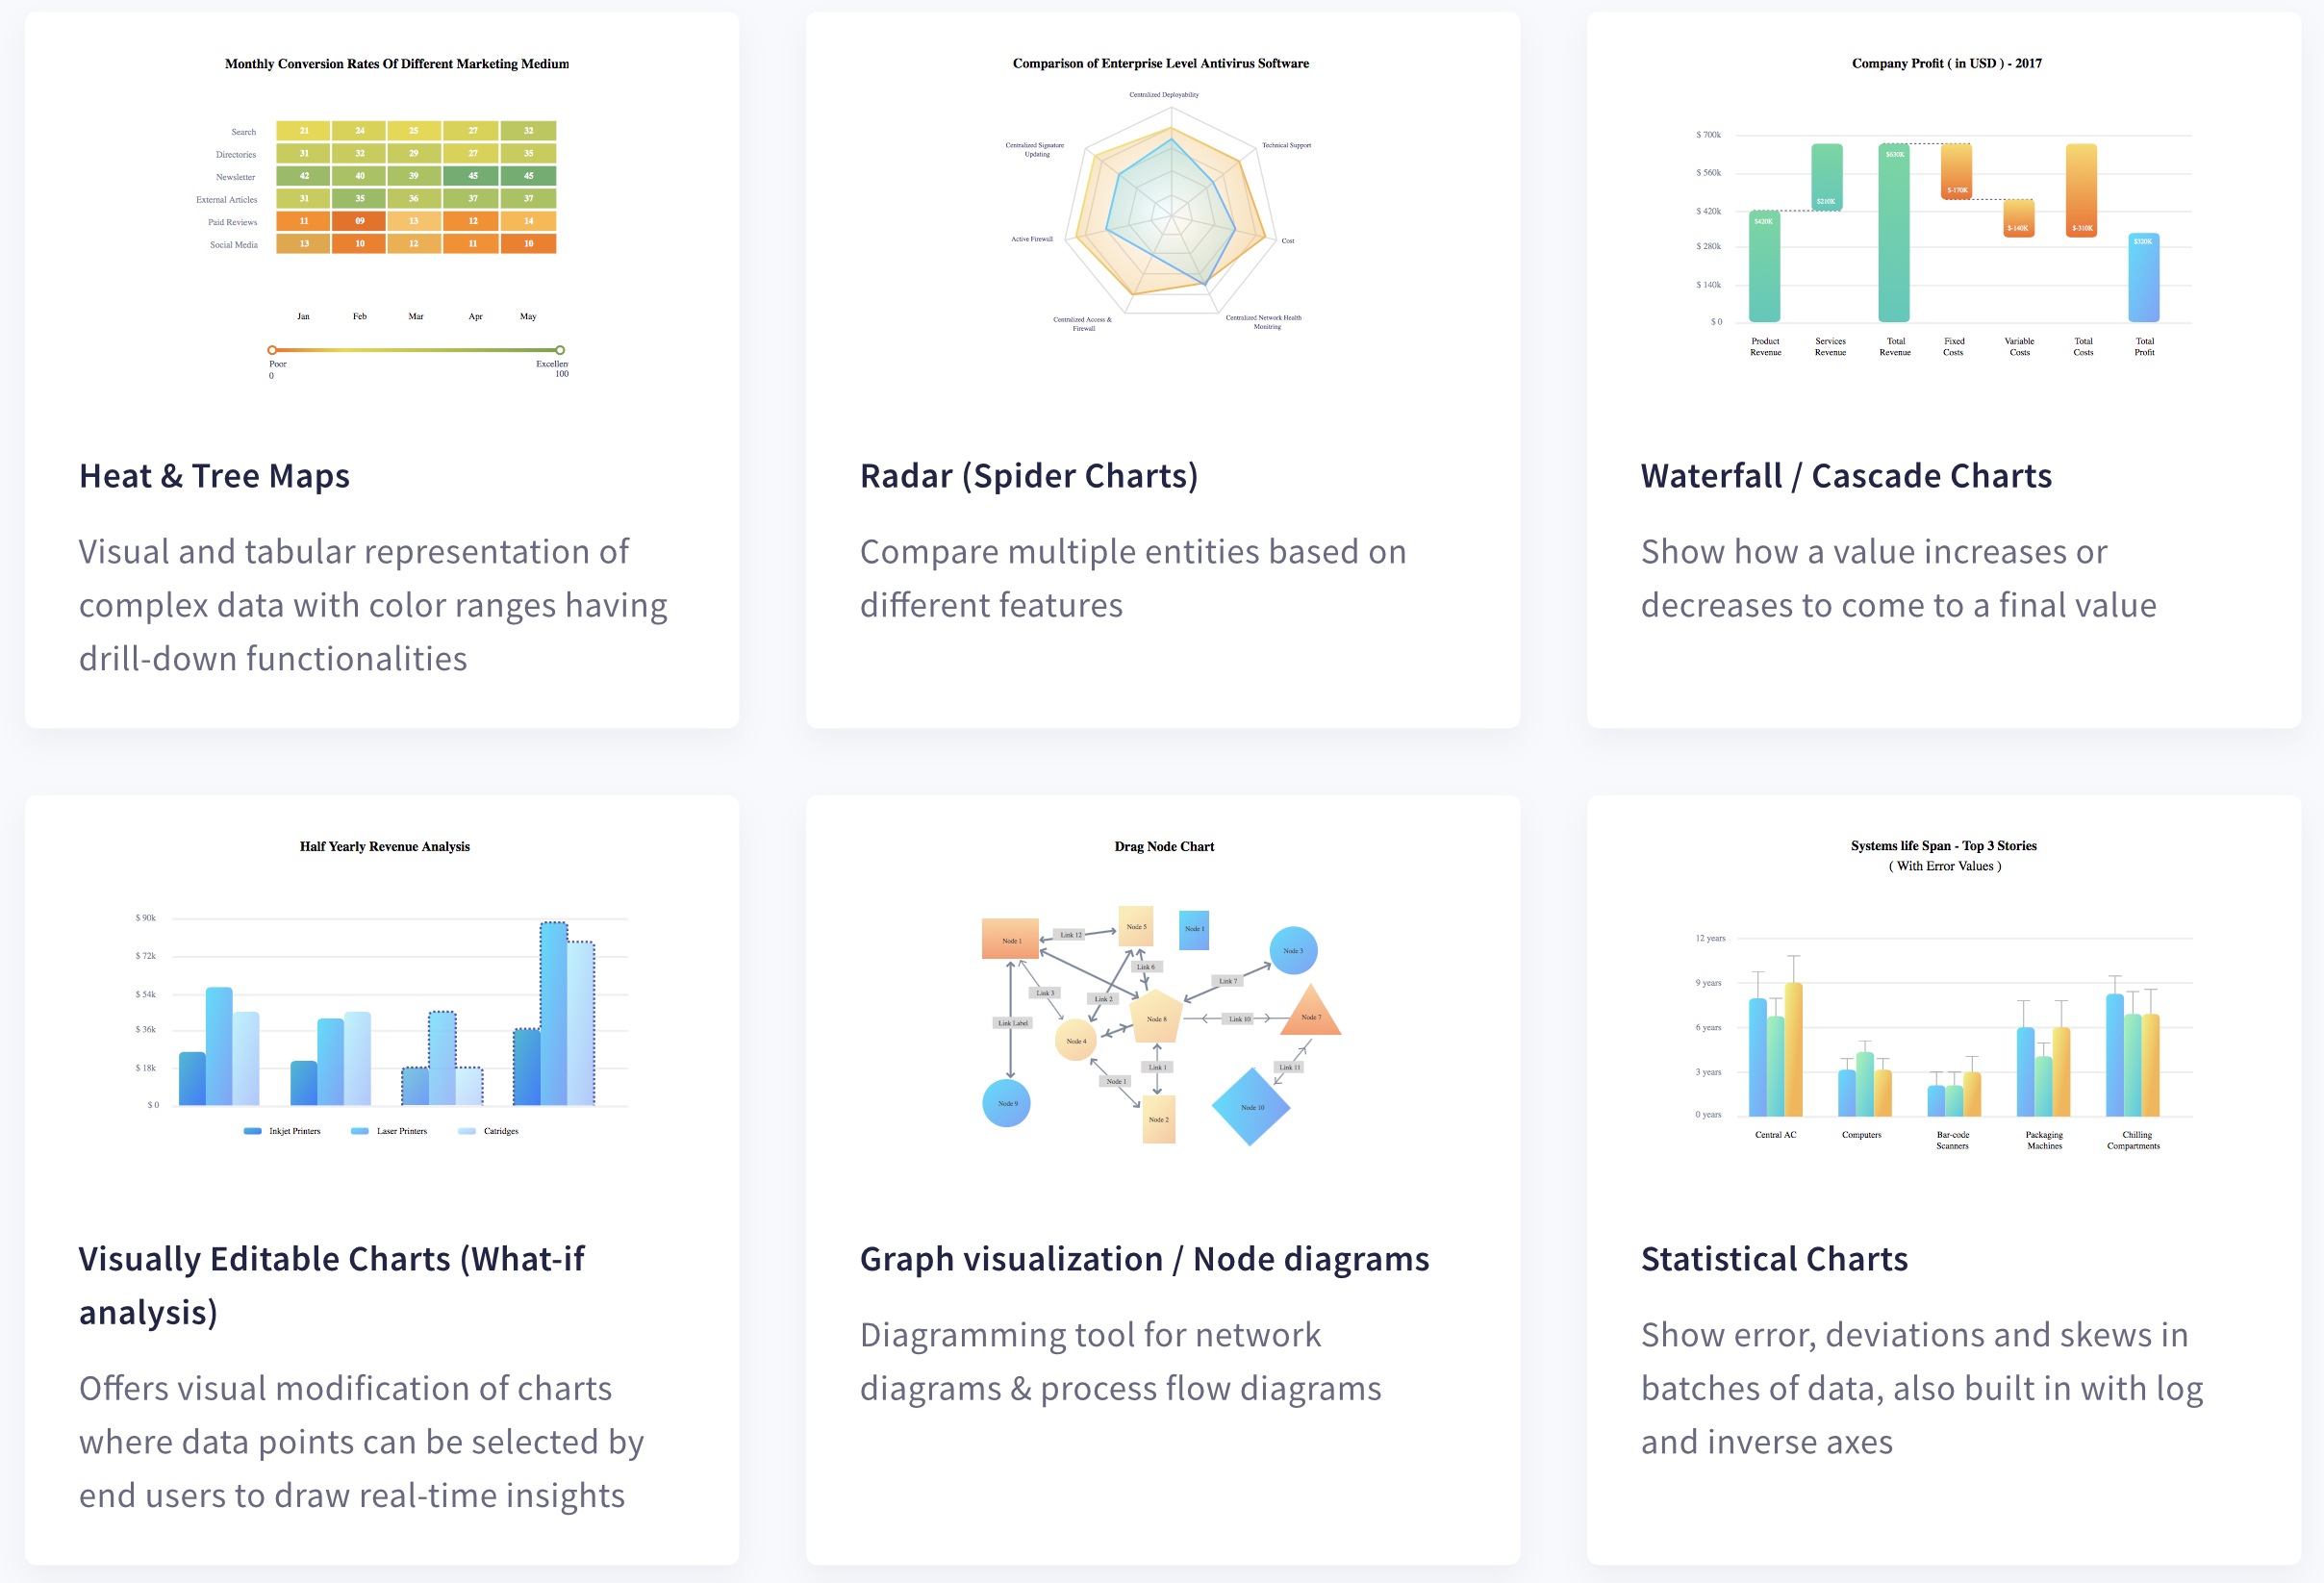
There is no charting or graphing library that can beat FusionCharts in terms of a variety of charts, graphs, maps, and gauges. There are over 100 different types of charts to choose from, along with more than 2000+ choropleth maps. FusionCharts supports the more common line charts, area charts, bar charts, pie charts, and more. Also, domain-specific charts like Gantt charts, radar charts, heatmaps, stock charts, and more are available.
6. Which Charting Library Has Less Development Time than Highcharts?
FusionCharts has a close to the zero learning curve. You can get your first chart ready in as little as 15 minutes. The APIs are easy to call and consistent across all charts and graphs. Developers can easily and effortlessly get a data visualization application ready in no time. FusionCharts provides default functionality for every chart, graph, gauge, and map, which normally suffices for all your needs. For example, panning, zooming, and scaling are enabled in all-time series charts along with a time navigator. All you have to do is specify the type of chart you require and the data points; the rest is taken care of.
7. Does FusionCharts Beat HighCharts for More Responsive Charts?
Of course! FusionCharts is superior to all other charting and graphing libraries. All graphs and charts are responsive and interactive by default. However, if you don’t want to stick to the default behavior, you can override it. With FusionCharts’ event handlers, you can also customize responses to all types of mouse and keyboard interactions. You can define your own handlers for various data events such as fetching data, updating data, and more. You can also write your own routines for chart events such as chart render, chart initialization, chart update, and more.
8. Does FusionCharts Have a Superior Interface than Highcharts?
Again yes! FusionCharts provides beautiful presentations, coherent color schemes, and various themes that you can configure for your particular application. FusionCharts even allows its users to build their own themes.
9. Does FusionCharts-the Highcharts Alternative Support 10,000+ Data Points For Plotting?
There are many charting libraries out there that have the option to plot a handful of data points. However, many of them either fail or render very slowly when the data points are of the order of tens of thousands of points. FusionCharts supports special zoom line charts that not only efficiently plot a large number of points but also allow users to zoom in and zoom out to get detailed or holistic views of data.
10. Does FusionCharts Have a Wider Customer Base than Highcharts?
FusionCharts is in use all over the world and has a very large customer base consisting of more than 800,000 developers and more than 28,000 companies. FusionCharts clients include big corporations like Autodesk, IBM, Dell, Adobe, Huawei, and more.
How Do I Get Started With FusionCharts?
FusionCharts is an awesome graphing and charting library. Don’t waste your time exploring other options when you have FusionCharts-a cost-effective, efficient and reliable solution with 24/7 support and extensive documentation. It is easy to get started with FusionCharts. If you want to try it out first, you can download a free trial and test it out while you are still in the development stages.
Make the most of your data. Download FusionCharts today and get started.
