Key takeaways
- Yellowfin has led business analytics for 15 years, delivering strong ROI through faster time to market and cost control
- Guided Natural Language Query and the Data Storytelling module let users generate reports and mobile-friendly narratives in plain English
- Automated Business Monitoring and Signals auto-detect trends and anomalies without manual digging
- Embedded analytics, self-service BI, and open APIs let software companies build Yellowfin’s capabilities into their own products
- Support for external JavaScript libraries like FusionCharts, plus connectivity to virtually any data source, enables fully customized, enterprise-ready visualizations
Business intelligence software and analytics and reporting tools support every stage of the business lifecycle, gathering data from diverse sources like the internet, journals, and images, then preprocessing it into structured formats for data stories, dashboards, and visualizations. Beyond presentation, these tools power data mining, monitoring, trend forecasting, and predictive modeling, making them essential to decision-making at enterprises of every size. As organizations look to 2026, Yellowfin has emerged as a preferred choice among reporting and analytics platforms.
Table of Contents
Why is Yellowfin the Preferred Choice for Analytics and Reporting Tools?
Yellowfin has been recognized as the leader in business analytic solutions for the past 15 years. Many reasons guarantee return on investment including new business capabilities, faster time to market and full control over cost. Yellowfin’s innovative solutions and capabilities take the dashboards and reporting tools to a whole new level. Continue reading to discover a few of Yellowfin’s features and products.
Which Companies Lead the Market in Advanced Analytics and Reporting Technologies?
Yellowfin stands out among today’s top contenders, backed by a set of capabilities that set it apart from standard BI platforms:
What is Yellowfin’s Guided Natural Language Query?
Yellowfin’s Guided Natural Query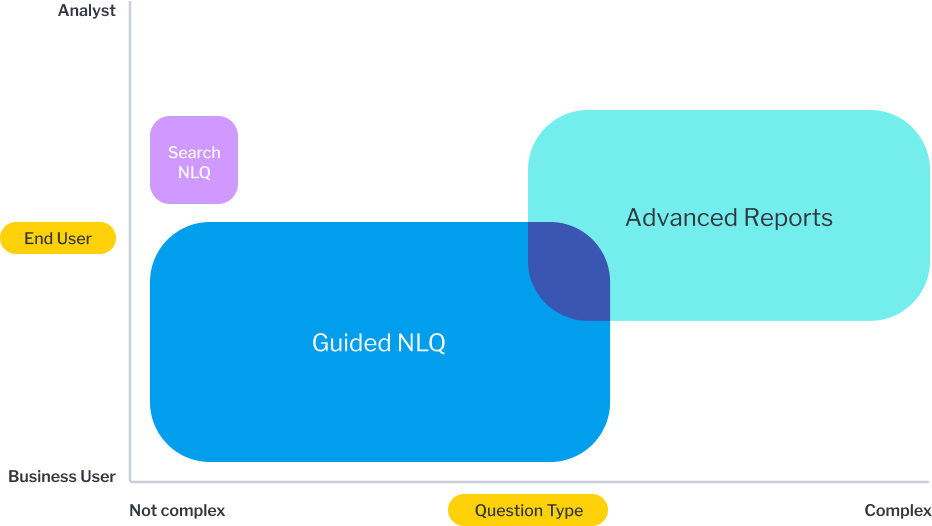 (NLQ) feature that allows users to specify English language based syntax for developing ad-hoc reports. This empowers business leaders to foster a data-driven culture and help drive informative and educated decision-making based on the facts portrayed by data.
What is Yellowfin’s Data Story Telling Module?
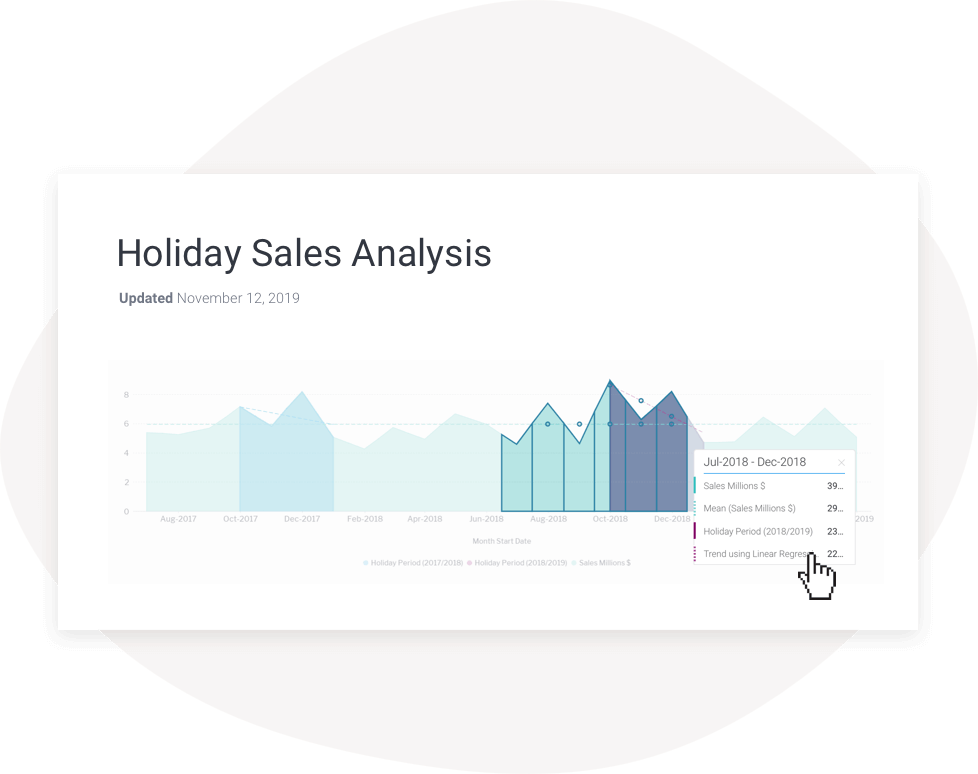
The data storytelling module is Yellowfin’s proprietary collaboration analytics solution for a deeper and enhanced understanding of your data. You have the option to use Yellowfin Stories or Yellowfin Present.
- Yellowfin Stories has the capacity to alter how people consume and learn from data. They can share knowledge and insights in a news-like style, especially tailored for mobile. This keeps everyone updated and on the same page.
- Yellowfin Present allows you to create accurate data-led presentations and management and financial reports. The unique feature in these presentations is that data is accurate 24/7 with a dynamically updating feature. Executives, managers and CEOs can view the reports anytime while having the confidence that the data is up-to-date.
How does Yellowfin Deliver Automated Business Monitoring?
Automated business monitoring (ABM) is also known as automated analytics or automated reporting. This feature allows your analytics software to auto-detect and auto-monitor trends and patterns in data. It also adds the capability to detect anomalies and deviations in data. Yellowfin’s signals uses complex ranking algorithms in the background to not only identify the most relevant deviations in data but also pinpoint where they occurred.
What are the Embedded Solutions Provided by Yellowfin?
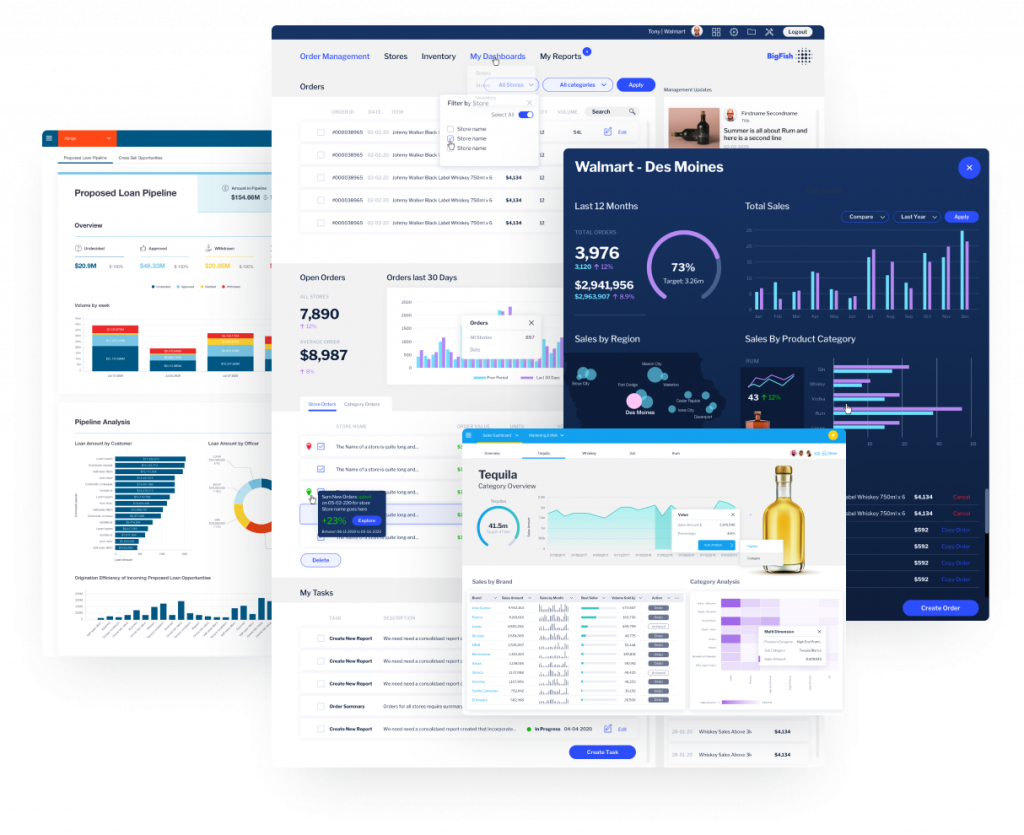
If you are a software company, Yellowfin empowers you to embed world-class dashboards and analytics into your software. You can give your clients access to their data in the form of stunning dashboards and charts.
- Pre-built dashboards that deliver important automated insights, seamlessly integrated into the software you are building
- Self-Service business intelligence, letting clients build their own ad-hoc reports and accelerate discovery
- Contextual embedding, incorporating visualizations or dashboards directly into your application’s workflows
- APIs that allow you to add reports, charts and dashboards to your software with minimal code
What is Yellowfin’s Mobile BI?
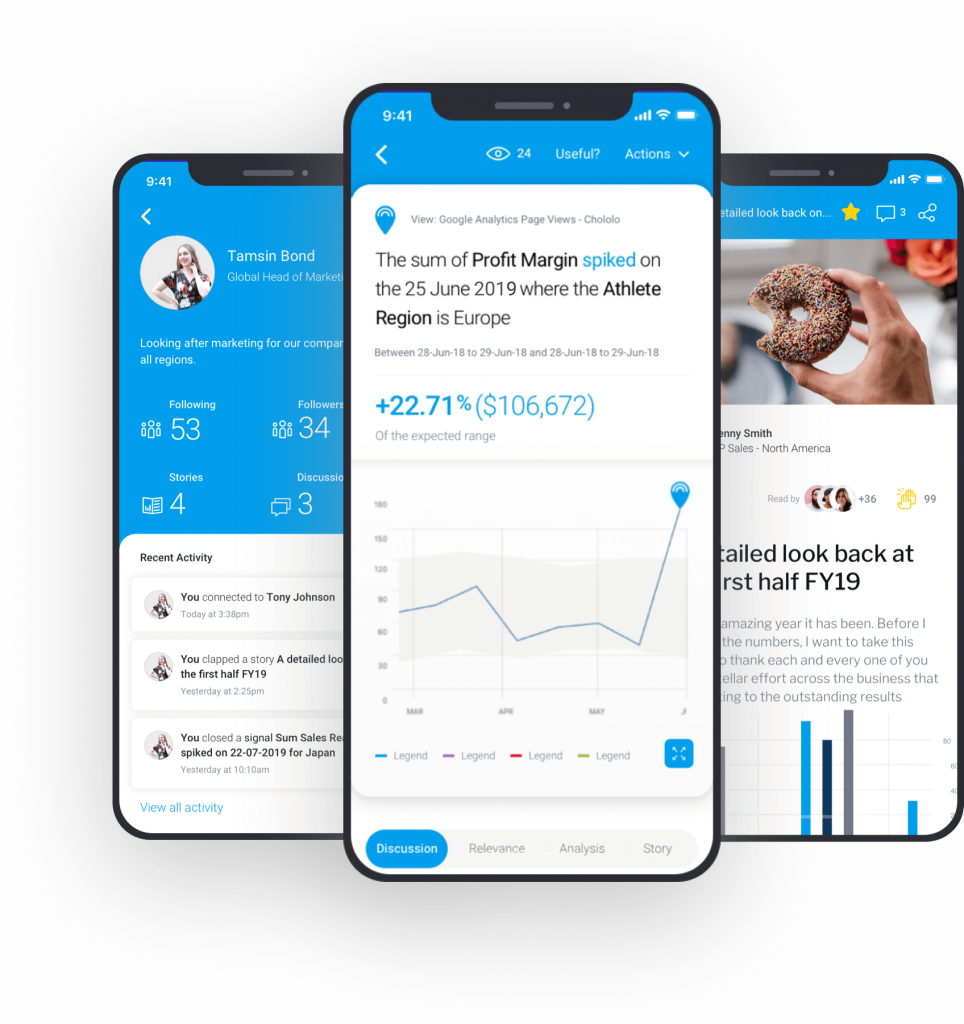
Yellowfin’s dedicated team of professional have optimized its design to runs on all types of mobile platforms. Users can now access their data anywhere anytime. You can now discover, collaborate, monitor and take data-driven actions using the Yellowfin’s mobile app. Yellowfin empowers you to develop a data driven culture and enrich your business decision making processes by letting data be its main driving force.
What Analytics Solutions Integrate Easily with Cloud Data Storage Services?
With Yellowfin, you don’t have to use a proprietary database. You are certainly free to choose any source of data, and query its records without having to move it. Whether its analytic databases like Google Big Query, Redshift, SAP Hana or the likes, or relational database like MySQL, HSQL, SQLite or more, Yellowfin has you covered. You can even use data from your spreadsheets, which act like any other data source.
With Yellowfin, you don’t have to use a proprietary database. You are free to choose any source of data and query its records without having to move it.
| Database Type | Examples |
| Analytic databases | Google BigQuery, Redshift, SAP Hana |
| Relational databases | MySQL, HSQL, SQLite |
| Other sources | Spreadsheets |
How can I Optimize My Business Processes with Analytics and Reporting Tools?
You can certainly optimize various business processes by leveraging the Yellowfin’s analytics and reporting tools. Yellowfin’s action based dashboards, data story telling and automated discovery tools can let data be a driver for automated monitoring of various processes and future decision making. You can drive revenue growth and assist your customers more efficiently with improved services.
Which Charting Libraries can I Use With Yellowfin?
Since version 7.3, Yellowfin has opened up its charting layer, giving teams the flexibility to extend the platform’s native visuals with libraries they already know and use.
- Bring in any external JavaScript charting library, including options like FusionCharts, D3.js, or Highcharts
- Write custom code to fully control the look, feel, and behavior of charts and graphs
- Build and manage these custom visualizations directly through Yellowfin’s Chart Builder
- Keep enterprise security, governance, and content migration intact, even when using third-party charting tools
Where can I Learn More to Develop Powerful Business Solutions With Yellowfin and FusionCharts?
FusionCharts (our data visualization tool) is a charting library with SDKs across many programming languages, built for creating stunning charts, gauges, and maps. Paired with Yellowfin’s analytics and BI capabilities, FusionCharts’ visually rich rendering drives greater efficiency, productivity, and decision-making — giving you an off-the-shelf, ready-to-use analytics solution for building a data-driven culture at enterprise scale.
Explore more of Yellowfin features and sign up for your free trial today!
Conclusion
Yellowfin brings natural language querying, automated monitoring, embedded analytics, and flexible data connectivity together in one platform, helping enterprises scale reporting without added complexity. Paired with FusionCharts, it offers a ready-to-use foundation for a genuinely data-driven organization. Worth a trial run for anyone evaluating analytics platforms in 2026.
FAQs
What are the leading analytics platforms used by major enterprises?
Yellowfin is among the leading platforms enterprises turn to, recognized for 15 years as a leader in business analytics solutions with strong ROI through faster time to market and full cost control.
Which reporting tools offer the best data visualization features?
Yellowfin, especially when paired with FusionCharts, offers strong data visualization through custom JavaScript chart library integration and its own Chart Builder functionality.
Which analytics providers offer strong predictive capabilities?
Yellowfin offers predictive capabilities through its automated business monitoring and Signals feature, which auto-detects trends, patterns, and anomalies in data.
How to compare leading platforms for interactive data dashboards?
Yellowfin’s action-based dashboards support real-time monitoring, mobile access, and embedded analytics, making them well-suited for interactive, data-driven decision-making.
How can I trial leading analytics software before committing to a purchase?
You can sign up for a free trial of Yellowfin to explore its dashboards, data storytelling, and reporting features before purchasing.