Time series analysis and visualization play a key role in the corporate and business worlds. A time-series depicts changing or fluctuating variables over time. This makes it is an indispensable tool for projecting profits, forecasting, marketing, and much more.
While many automated tools for time series visualizations exist, there are hardly any tools for interactively panning, zooming, and scaling a series. This is a big omission. When manually observing a time series, managers, developers, or data scientists want to examine a time series over a larger time span to infer long-term trends in data. On the other hand, they also want to zoom in on a portion of the series to see short-term fluctuations in variables on the data charts.
FusionCharts comes with an awesome FusionTime library. The FusionTime library lets you plot and analyze time-series data with its time navigator feature. With the Time Navigator, an analyst can focus on a part of the time series, while keeping the whole long-term data trend in view. In this blog, we’ll build an app for visualizing a time series with the time navigator component. We’ll plot the CalIt2 building people count data set, which shows the volume of people coming in or out of the building. The dataset is from the UCI machine learning repository.
Table of Contents
Features Of FusionCharts Time Navigator
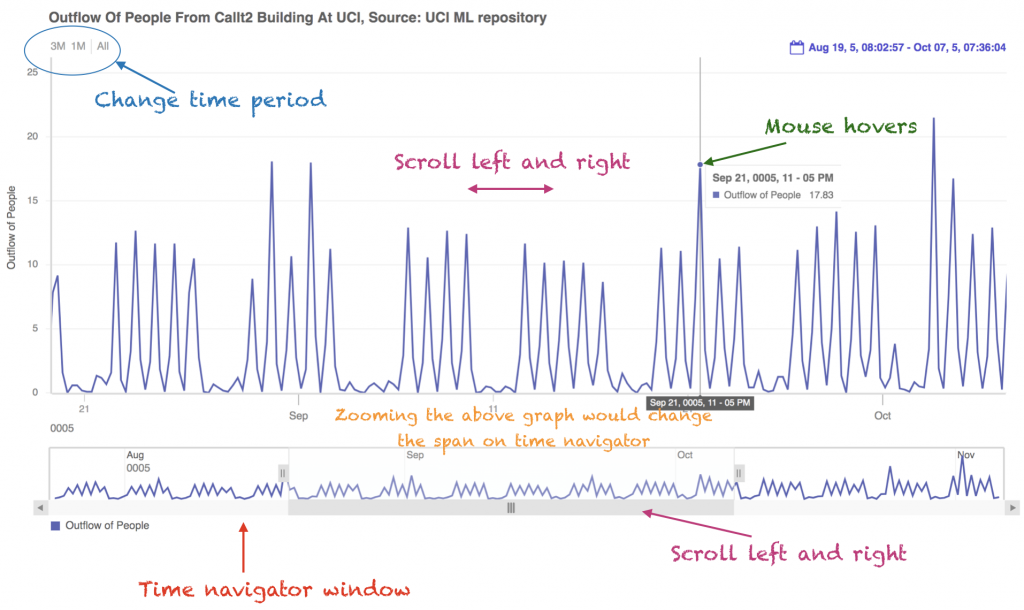
The time series and time navigator components look like this. This shows the outflow of people from the UCI’s CalIt2 building and has some spectacular time navigator features, which we annotated below:
Features Of FusionCharts Time Navigator
Zooming: The FusionCharts time series allows a user to zoom in and display smaller time periods in more detail. The time navigator also shows which parts of the time series have been zoomed.
Panning: The user can move the scrollbar of the time navigator window and look at specific fixed time periods of the graph.
Scrolling: The user can move a data point of the time series itself to move the series left or right.
Datapoint average on hover: When the mouse hovers over a data point, it displays the value of the datapoint. For a zoomed-out plot of larger time spans, the average or the data points is also shown.
Customization: FusionCharts allows everything to be fully customized, from axis labels to the caption, tick mark labels as well as graph colors.
Change time periods: The top left corner allows a user to select different time periods for displaying the time series.
Data format: You can input the data you want to plot as JSON or a simple table. This makes it extremely easy to create a plot from all types of data sources.
The CalIt2 Dataset
The first few lines of the CalIt2 dataset are shown below:
The data is a comma-separated table. The first column is 7 for outflow and 9 for inflow. We’ll plot only the outflow. The second and third columns are date and time. The last column is the count of people.
Steps For Creating The Time Series Plot With Time Navigator
Plotting the time series using the FusionTime library is extremely easy. Here are three easy steps to create a Webpack App that displays the time series plot with the time navigator component.
Step 1: Project Setup
Create a project directory called timenavigator. At the console move to the project directory and type the following to install Webpack and FusionCharts:
npm i -D webpack-dev-server html-webpack-plugin path webpack-cli fusioncharts
Create a dist and src sub-directory in the project directory. Also, create an empty file index.js, which would contain the source code for the project. Next, tt the console, type the following:
mkdir src
touch src/index.js
mkdir dist
Step 2: Project Configuration
To configure the project, create a file called webpack.config.js in the main project directory and then add the following code to it:
The configuration above includes a proxy to prevent CORS errors when reading data from the UCI machine learning repository.
Step 3: Import Libraries, Create The Datasource, Render Chart
Finally, add code to the index.js file, which does the following:
Imports the necessary FusionCharts libraries.
Sets up a schema that contains the meta descriptions of the columns to be plotted.
Reads data from the UCI machine learning repository.
Converts the data to a table.
Sets up a DataStore.
Creates a FusionCharts instance and renders the plot.
Then, copy the following code into your index.js file:
// src/index.js

//Import section
import FusionCharts from 'fusioncharts/core';
import TimeSeries from 'fusioncharts/viz/timeseries';
import DataStore from 'fusioncharts/datastore';

//Add the div tag for the chart container
const myDiv = document.createElement('div');
myDiv.id = 'container';
document.body.appendChild(myDiv);

//Set up the schema for two table columns
let schema = [{
    "name": "Date",
    "type": "date",
    "format": "%-m/%-d/%Y %-I:%-M:%-S"
}, {
    "name": "Outflow of People",
    "type": "number"
}]

//main function read data and call renderPage
async function main() {
    //Get the data
    let response = await fetch('/UCIAPI');
    let text = await response.text();
    if (response.ok){
        renderPage(text);
    }
    else {
        alert('Error reading data from ML repository');
    }
}

//Convert the UCI ML data to two column table and draw chart
//renders the html page when passed data as text
function renderPage(text){
    //Convert data to table
    var data = textToMatrix(text);
    //Draw teh chart with this data
    drawChart(data);
}

//convert text to matrix. The data read from UCI ML repository is comma separated
function textToMatrix(text){
    var matrix = [];
    var rows = text.split("\n");
    for(var i=0;i<rows.length;i++){
        var cols = rows[i].split(',');
        //7 is out flow in CalIt2.data
        if (cols.length > 1 && cols[0] == 7)
            var dataRow = [cols[1].concat(' ', cols[2]), parseInt(cols[3])]
            matrix.push(dataRow);
    }
    return matrix;
}

//Render the final chart
function drawChart(data){
    FusionCharts.addDep(TimeSeries);

    let fusionDataStore = new DataStore();
    let fusionTable = fusionDataStore.createDataTable(data, schema);

    window.charInstance = new FusionCharts({
        type: 'timeseries',
        renderAt: 'container',
        width: "90%",
        height: 650,
        dataSource: {
            data: fusionTable,
            caption: {
                text: 'Outflow Of People From CalIt2 Building At UCI, Source: UCI ML repository'
            }
        }
    });

    //Render the chart
    window.charInstance.render();
}

main();
Running The App
To run the app, type the following at the console:
npx webpack serve --mode=development
You can view the app in the browser by navigating to localhost:8080
Are There More Ways To Visualize Time Series Data?
If you are looking for quick and easy methods of adding beautiful charts and plots to your app, FusionCharts is the answer for you. FusionCharts includes 100+ charts and 2000+ interactive maps. The FusionTime module lets you create time series from basic to more complex multivariate series having millions of data points. FusionTime includes out-of-the-box interactivity like time navigator, date range selectors, interactive legends, and much more. The best part is that creating a time series in Javascript requires only a few lines of code.
Download your free FusionCharts trial today and create impressive and stunning apps with beautiful plots and charts!
Download the complete source code for the time navigator app here. Happy coding!
From column to donut and radar to gantt, FusionCharts provides with over 100+ interactive charts & 2,000+ data-driven maps to make your dashboards and reports more insightful