Table of Contents
Introduction
With customer expectations constantly evolving, marketers are always looking to innovate and improve marketing analytics. This involves leveraging truckloads of data to inform marketing strategies and ultimately make decisions that ensure success. Marketing dashboards are one useful tool marketers use to inform decision-making and track the impact of those decisions.Marketing dashboards are to marketers what heart rate monitors are to doctors. It pulls together all the marketing data and campaigns relevant to your business goals and displays improvement areas, thus informing your decision-making process.
This article discusses 10 marketing dashboard examples and what they track. But before we delve into that, we must define what a marketing dashboard is and what it should include.
What Is A Marketing Dashboard?
Digital marketing campaigns produce so much data that extracting and analyzing what’s needed can get overwhelming. What’s more, the proliferation and increased pervasiveness of digital channels make matters worse. It is therefore critical, now more than ever, to separate relevant from irrelevant data. And, it is in the tracking of strictly useful data that a marketing dashboard becomes invaluable.
In a nutshell, marketing dashboards are digital consoles that enable marketing data visualization, including key performance indicators (KPIs) or any metric you want to track. This could be metrics like sales volume, revenue, or any key metric that measures the performance of your marketing strategy. In other words, a marketing dashboard compiles all relevant data from numerous data sources relative to your performance into a single snapshot. This compilation can be exported into a marketing report, which you can analyze to gain insights that can improve campaigns, brand awareness, etc.
What Are The Benefits Of A Marketing Analytics Dashboard?
A marketing dashboard is a robust tool that enables businesses to harness the power of data. Let’s explore the numerous benefits it offers:Improving Business Development & Growth
With the help of a marketing dashboard, which offers thorough insights into essential performance indicators, companies may spot growth opportunities and develop expansion strategies. Through dashboard tracking, which includes metrics like revenue generation, conversion rates, and client acquisition cost, organizations can make well-informed decisions that propel business development and attain long-term success.Strengthening the Marketing Strategy
With a marketing analytics dashboard, businesses can monitor the effectiveness of their marketing campaigns in real time. By analyzing metrics like website traffic, social media engagement, and email open rates, marketers can refine their strategies for maximum impact. This agile approach enables businesses to adapt quickly to varying market conditions and stay ahead of competitors.Enhancing Team Collaboration
A marketing dashboard promotes team cooperation by providing a centralized data access and exchange platform. Team members may visualize performance indicators and exchange insights with each other through a marketing dashboard, which encourages openness and alignment between departments. This cooperative strategy promotes effective communication and improved decision-making, which fuels corporate success.Improving Visibility Across the Organization
One of the key benefits of a marketing dashboard is its ability to provide visibility into marketing performance across the organization. Businesses can obtain an extensive view of their marketing efforts by consolidating data from various sources into one centralized dashboard. This visibility enables stakeholders to track progress, identify trends, and make data-driven decisions to achieve organizational goals.More Control Over Inventory
Besides monitoring marketing outcomes, a marketing analytics dashboard may assist companies in better inventory management. Businesses may watch sales patterns, monitor stock levels, and streamline inventory management procedures by including inventory data in the dashboard. With this improved inventory visibility, businesses may minimize stockouts, decrease excess inventory, and increase overall operational efficiency.What Should Be On A Marketing Dashboard?
Gathering data is important for the success of any marketing campaign. But what is even more critical is having actionable data. In other words, your dashboard should include key data that provides high-quality insights into the marketing activities you intend to monitor.A successful marketing dashboard finds a balance between key metrics and available data. Although different organizations may have different approaches to dashboard creation, a general rule of thumb is to feature metrics based on business goals. For example, if increasing ROI is the aim, metrics surrounding revenue growth or sales volume should be featured.
The Top Metrics To Track On Your Marketing Analytics Dashboard And Reports
Tracking the right metrics on your marketing analytics dashboard and reports is crucial for evaluating the effectiveness of your campaigns and making informed decisions. Here are the top metrics you should include:- Customer Acquisition Cost (CAC): CAC measures the cost incurred to acquire a new customer. It helps you understand how much you’re spending on marketing efforts relative to the number of customers gained. Calculated by dividing total acquisition costs by the number of new customers acquired within a specific time frame.
- Return on Ad Spend (ROAS): ROAS quantifies the revenue generated for every dollar spent on advertising. It indicates the profitability of your advertising campaigns. Calculated by dividing revenue generated from ads by the total cost of the ads.
- Website Traffic: This metric measures the volume of visitors to your website. Monitoring website traffic helps gauge the effectiveness of your marketing efforts in attracting potential customers. It can be tracked using tools like Google Analytics.
- Cost Per Click (CPC): CPC reflects the average cost paid for each click on your ads. It’s essential for evaluating the efficiency of your pay-per-click (PPC) campaigns and optimizing your advertising budget.
- Engagement Rate: Engagement rate measures the level of interaction users have with your content or ads. It includes likes, shares, comments, and other forms of engagement. A high engagement rate indicates that your content resonates well with your audience.
- Organic Search Traffic: Organic search traffic refers to the visitors who find your website through unpaid search engine results. Monitoring organic search traffic helps assess the effectiveness of your SEO efforts in improving visibility and attracting organic visitors.
- Lead Conversion Rate: This metric tracks the percentage of leads that convert into customers. It helps measure the efficiency of your sales funnel and identifies areas for improvement in converting leads into sales.
What Is The Best Marketing Analytics Dashboard?
There are numerous marketing dashboard templates out there. For example, financial dashboards. However, the best depends on your marketing activities and objectives. Here are 10 marketing dashboard examples with key metrics that may be useful to your strategy.Marketing Performance Dashboards
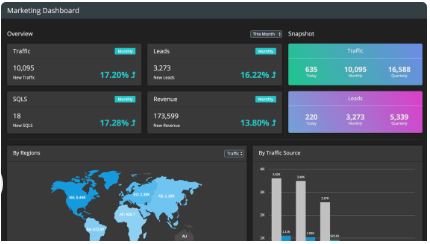
A marketing performance dashboard features all KPIs as well as the conversion funnel. This dashboard pulls together all or the relevant information from different sources into a single snapshot to enable marketers to monitor at a glance and inform marketing initiatives on improving conversions, revenue, and other vital indicators.Marketing performance dashboards also typically track key metrics like site visits, traffic sources, and the purchase funnel.
Digital Marketing Dashboards
As the name implies, digital marketing dashboards allow you to track and monitor your digital channels’ marketing activities. This also enables you to target your digital marketing efforts better. A great precursor for an online marketing dashboard is identifying your target audience and data sources (where your target audience is).There are various marketing channels – including social media, advertising, email marketing, and websites – and thus, identifying those most relevant to your strategy sets you up for success.
A typical digital marketing dashboard features lead generation and web analytics data.
SEO Analytics Dashboards
An SEO analytics dashboard provides a detailed outlook on your SEO performance through several valuable metrics.A high SEO ranking can be a measure of authority in most markets. In this case, many marketers use a bunch of SEO KPIs and other relevant metrics to monitor their SEO online marketing efforts.
Additionally, an online marketing dashboard pulls data from various SEO sources into a single view. Therefore, enabling users to monitor SEO efforts at a glance. However, it doesn’t end there; it also provides insight into what marketing areas your marketing team can focus their SEO optimization efforts.
This dashboard tracks metrics, such as:
- Keywords on Page 1
- Organic vs. paid traffic
- Page load speed
- Number of indexed pages
- Internal/external links
- Top landing pages
- And more!
eCommerce Marketing Dashboard
An eCommerce marketing dashboard features eCommerce-related KPIs and metrics.- Cost per lead
- Abandoned cart
- Web traffic sources
- Churn rate
- Retention
- Add to cart
- Goal completion rate
Web Analytics Dashboards
As the name implies, a web analytics dashboard features relevant website KPIs and metrics. This allows for real-time assessment of your website performance relative to your objectives.Also, this dashboard leverages Google Analytics data, and you can track website performance using metrics such as:
- Online conversions
- Bounce rate
- Page views
- Website visitors
- Pages viewed per session
- Referral traffic, unique, and new visitors
- Traffic sources
- And much more!
Create your Google Analytics dashboard with FusionCharts
Social Media Marketing Dashboards
This marketing dashboard compiles all social media marketing into a single view. Therefore, it allows you and your marketing team to monitor your social media efforts in one place.Due to how effective social media platforms are as marketing channels, it often influences larger marketing objectives. Some useful marketing metrics typically tracked with this dashboard include social engagements and traffic sources.
Custom Social Media Dashboards
If you’re looking to track and monitor the performance of a specific social media channel, the general social media dashboard might seem too bulky. In this case, a custom dashboard for that channel could be useful. For example, this could be YouTube or Facebook Ads dashboard.The metrics and KPIs displayed on this dashboard depend on the channel you intend to monitor. For example, you can pull data from Google Analytics or Google Data Studio for Youtube Ads dashboards.
Content Marketing Dashboards
This dashboard offers a snapshot where you can track and monitor all your content marketing efforts. Content marketing can be an effective approach to engaging, interacting, and getting your message across to your target audience.Typical metrics tracked with this dashboard include:
- Downloads
- Reads
- Comments
- Shares
- Likes
- Sales
- Conversions
- Inbound links
- Referral traffic
Email Marketing Dashboards
An email marketing dashboard highlights all the relevant metrics and KPIs illustrating the performance of your email marketing campaigns. Hence, helping you implement improvements where and when necessary.Email marketing is also an effective means to guide your prospects through the buyer’s journey. From a welcome email to a product suggestion email (based on customer activities), you can better inform your email campaigns with insights from an email marketing dashboard.
This dashboard tracks email-related metrics, such as click rate and open rate.
Enterprise Marketing Dashboard
This dashboard pulls together a visual reporting of enterprise KPIs and metrics across all departments. This enables enterprise-wide performance monitoring, thus, making it easy to identify real-time issues and facilitate quick improvements.How to Create a Marketing Dashboard
Creating a marketing dashboard is a strategic process to consolidate data and insights to inform marketing strategies and optimize performance. Here’s a full breakdown of the steps involved:Identify Your Target Audience
Start by conducting complete market research to identify your target audience. Understand their demographics, preferences, behaviors, and pain points. This foundational understanding will shape your marketing strategies and messaging.Define Stakeholder Objectives
Engage with key stakeholders, such as marketing managers, executives, and sales teams, to define clear objectives for the marketing analytics dashboard. These objectives should coordinate with broader business goals and focus on metrics that matter most to the organization’s success.Establish Key Marketing Performance Indicators (KPIs)
Based on stakeholder objectives, establish key performance indicators (KPIs) that will measure the efficacy of your marketing efforts. These KPIs could incorporate metrics such as customer acquisition cost (CAC), return on investment (ROI), conversion rates, customer lifetime value (CLV), and website traffic.Identify Data Sources and Create a Unified View
Identify all relevant data sources that contribute to your marketing efforts. This may contain customer relationship management (CRM) systems, email marketing platforms, social media analytics, advertising platforms, and website analytics tools. Integrate these data sources into a centralized dashboard to create an integrated view of marketing performance.Visualize Your Data for Clarity
Utilize data visualization techniques to present complex data in a visibly appealing and easily accessible format. Choose appropriate charts, graphs, and tables to represent KPIs and trends effectively. Visualizing data enhances comprehension and enables stakeholders to identify insights and trends at a glance.Integrate Data from Various Sources
Implement robust data integration processes to pull data from disparate sources into the marketing analytics dashboard. This ensures stakeholders have access to comprehensive and up-to-date information in real-time. Integration also allows for cross-channel analysis, enabling a holistic view of marketing performance across different platforms and campaigns.Considering FusionCharts for Building Your Marketing Dashboards
By choosing FusionCharts for building your marketing analytics dashboard you can get a seamless experience with intelligent defaults easily configurable to suit developers’ needs. With default chart configurations that automatically optimize data presentation, developers can visualize their marketing data effortlessly.FusionCharts boasts an extensive library of over 100 charts and 2000 maps, providing developers with the tools to visualize any data in any form from a single platform. What’s more, FusionCharts ensures a swift start, enabling developers to create their first chart in just 15 minutes without any learning curve. Its consistent API simplifies building complex charts or dashboards, streamlining development efforts.
Additionally, FusionExport facilitates easy dashboard exportation, allowing developers to generate charts on the server side and export dashboards as PDFs or send reports via email with unparalleled ease.
Here are a few points on why you should consider FusionCharts for creating a marketing analytics dashboard:
- FusionCharts liberates users from conventional reporting approaches by providing dynamic dashboards and real-time parameter customization options.
- It tackles data quality issues through functionalities such as data validation and error-checking mechanisms.
- FusionCharts facilitates seamless navigation through extensive datasets with intuitive data filtering and drill-down features.
- Users can leverage customizable data visualization templates and recommended practices to craft impactful data strategies.
What problems can a marketing Analytics dashboard alleviate?
Here are seven problems that a marketing analytics dashboard can effectively resolve:Lack of Data Visibility
Marketers need more data across platforms, hindering insights into campaign effectiveness. A marketing analytics dashboard aggregates data, providing a unified view of key metrics. This enhances data visibility, enabling analysis of audience engagement and ROI. Marketers can make informed decisions and optimize strategies for better performance.Inefficient Decision-Making
Without real-time data, marketers face inefficiencies in decision-making, leading to missed opportunities. A marketing analytics dashboard provides access to instant insights, enabling quick adjustments and optimized outcomes. With the ability to track performance and identify trends on the fly, marketers can make informed decisions, ensuring maximized ROI.Difficulty in Measuring ROI
Limited access to accurate data and analytics challenges marketers in measuring ROI. Yet, a marketing dashboard resolves this by offering insights into campaign performance metrics such as customer acquisition cost and conversion rates. With this data, marketers can precisely quantify the impact of their efforts and drive success through informed, data-driven decisions.Ineffective Campaign Tracking
Marketers often find it challenging to effectively track campaign performance across multiple channels and touchpoints. Yet, with the implementation of a marketing dashboard, they can track in real-time and pinpoint high-performing channels. With comprehensive data and analytics, marketers can make informed decisions about resource allocation, thereby maximizing the impact of their marketing efforts.Lack of Alignment with Business Goals
Aligning marketing efforts with business goals is crucial for meaningful results. Implementing a marketing analytics dashboard enables tracking KPIs tied to business objectives, like revenue growth. Marketers ensure alignment with organizational goals, fostering success through data-driven decision-making.Poor Resource Allocation
Limited visibility into campaign performance and ROI leads to inefficient resource allocation for marketers. Implementing a marketing analytics dashboard offers comprehensive insights into campaign and channel performance. With this data, marketers can strategically allocate resources to maximize ROI and improve campaign outcomes.Difficulty in Identifying Trends and Patterns
Identifying trends and patterns in marketing data can be challenging without clear visualization. However, a marketing dashboard simplifies this task by presenting data. With actionable insights, marketers can make data-driven decisions to optimize strategies and drive success.Conclusion
Marketing dashboards are indispensable tools in today’s data-driven marketing landscape, offering crucial insights for informed decision-making. By consolidating data and presenting it cohesively, these platforms enhance business development, refine strategies, and foster team collaboration.They empower marketers to track critical metrics across various channels, enabling agility and adaptability. Marketing dashboards address common challenges and pave the way for agile, data-driven strategies, guiding businesses toward growth and sustained success in the digital era. Harnessing their power is not just beneficial but imperative for staying competitive.
FAQs
👉 Why do you need a marketing dashboard?A marketing dashboard is crucial for businesses as it consolidates data from various sources, providing a comprehensive view of marketing performance. Tracking key metrics and KPIs facilitates informed decision-making, monitors campaign effectiveness, and ensures alignment with overarching business goals.
👉 How do you create a marketing dashboard?
Creating a marketing dashboard involves several steps: identifying target audiences, defining objectives, establishing KPIs, integrating relevant data sources, visualizing data, and continuously monitoring and adjusting performance to optimize effectiveness in informing marketing strategies.
👉 What is the difference between metrics and KPIs?
KPIs (Key Performance Indicators) are strategic indicators directly tied to business objectives, while metrics are tactical data points providing detailed insights into specific performance areas. KPIs assess progress towards long-term goals, while metrics offer insights into various aspects of business performance.
👉 What integrations does FusionCharts have?
FusionCharts integrates with various platforms and technologies, including JavaScript frameworks, server-side technologies, database systems, BI tools, and mobile platforms. This versatility makes it a flexible solution for data visualization across different platforms and technologies.
Need Help Building Your Marketing Dashboards?
Regardless of your dashboard building objectives, FushionCharts has got you covered. There is no such thing as a complex dashboard. Our team of experts has built marketing dashboard templates for whatever marketing campaign. Explore the numerous FusionCharts dashboards and get their source code with a click of a button for free.Download FusionCharts and start making better marketing dashboards today!