Being a financial advisor or a stock trader, you must know that time saving is important. Therefore, you try your best to quickly access the data reports using charts. However, the data we need depends on multiple factors. At the same time, we need the best charting tools to create live charts of our data. We can also use some free charts, but they have very limited features. On the other hand, live chart creation through reliable & premium quality tools represents accurate data. This article has listed some of the best charting software to build stunning charts. So what are you waiting for? Let’s start our reading journey here.

Table of Contents
What Should You Look For In JavaScript Charting Tools?
Every professional trader uses charts to display data with accuracy. For example, stock traders check past trends through charts and predict future movements. With a large number of charting tools available in the market, we may find it difficult to choose the right one. However, here is a list of things that we should look for in a charting tool.
Note that we must ensure that we can save and backup chart setups in our charting tool. At the same time, it should be user-friendly. The next five main criteria to look for in a charting tool are listed below:
- Customizable interfaces
- Screener
- Indicators
- Integration with the user’s broker
- Backtester
We can note the above factors or tips on data visualization in a better way. These are the basic requirements of reliable charting tools. Make sure that you know your specific needs and choose the tool accordingly. Now, let’s take a look at some best charting software of 2024.
What Are Some Reliable and Accurate Charting Software In 2024?
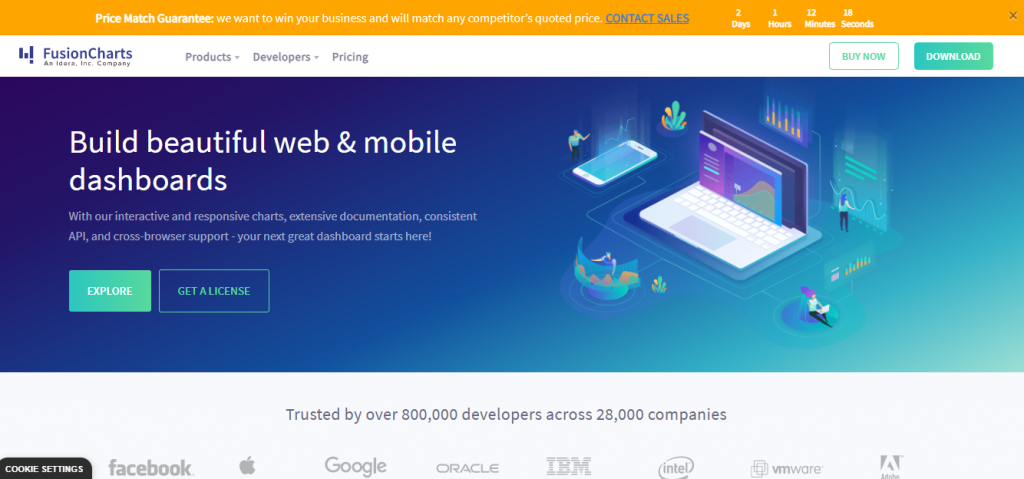
FusionCharts
FusionCharts is a data visualization software that functions through a web-based system. Moreover, it uses JavaScript programming language. As a matter of fact, FusionCharts is highly helpful for businesses ranging from small to large sizes. The primary goal of FusionCharts is to convert raw data into understandable charts or graphs.
Pros
- Organized business reports.
- Accessible company data
- Intuitive controls
Cons
- There are no many video examples.
Features
- Data Plots
- Charts Titles/Labels
- Number Formatting
- Trend lines
- Tooltips
- Legends
- Export Charts
- Drill Down
- Axis and Gridlines
- Chart Branding and many others
Pricing
FusionCharts gives us a free trial for 14 days. Moreover, the pricing plans vary depending on individual developers or enterprises.
Tableau
It is another data visualization tool that helps businesses to visualize data. We can make the most of our data by using this cutting-edge platform. Reports show that companies using Tableau become more data-driven and beat their competitors easily. The reason behind this is:
Pros
- It can be connected to any database
- A large variety of charts is available
- Dashboards are viewable on different devices.
- Advanced visualization abilities.
- Easy integration with Salesforce
Cons
- More time consumption in the data-finding process.
- Costly
- Unsaved logged information
Features
- Mobile-ready and shareable dashboards
- Automatic updates
- Data notifications
- Task management
- Email management
- Reporting & analytics
Pricing
The pricing plans start from $15 for executives and go up to $70 for analysts.

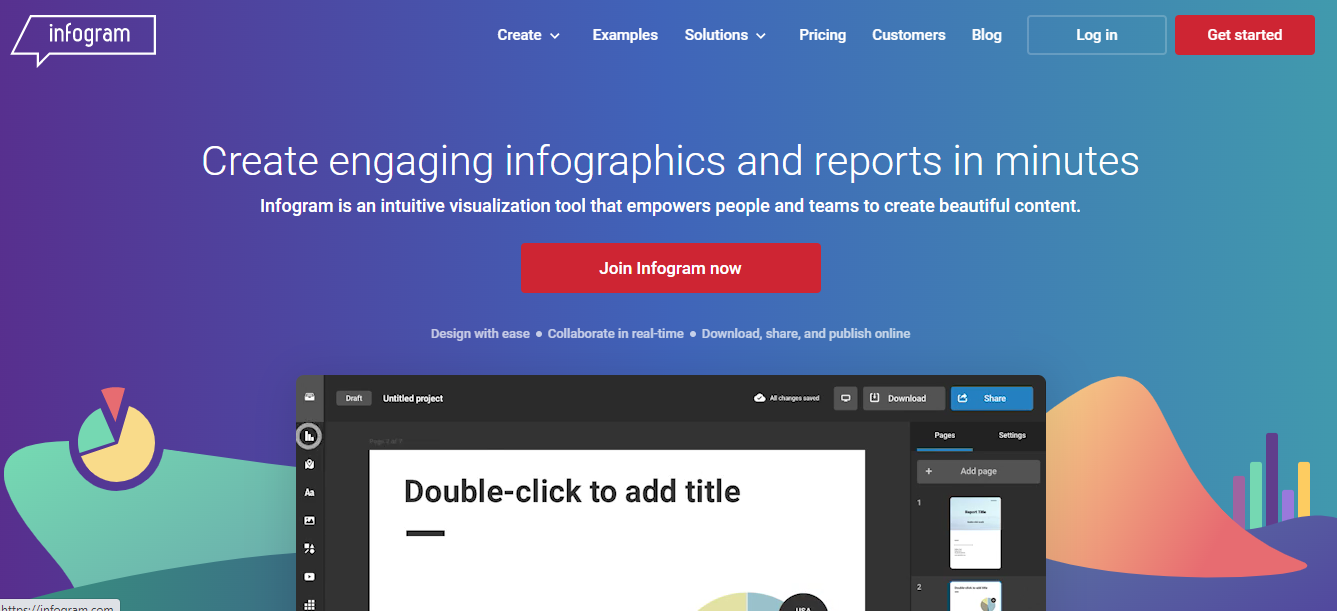
Infogram
Infogram is an easy-to-use and dependable software for data charting. We can present our key messages using the collection of tools that this one of the best charting software offers. Moreover, it also helps us to visualize the data through appealing and digestible illustrations.
Pros
- Higher usability
- Wider library of tools
- Outputs can be shared easily on different platforms.
Cons
- Disappointing free version.
- Data loss
- Difficult to understand
Features
- Custom theme
- Publish content
- Different map types
- Team functionality
- Custom development
- Premium themes
- Import data
Pricing
The pricing plans start from $25 and go up to $149 per month. It also offers a free plan.
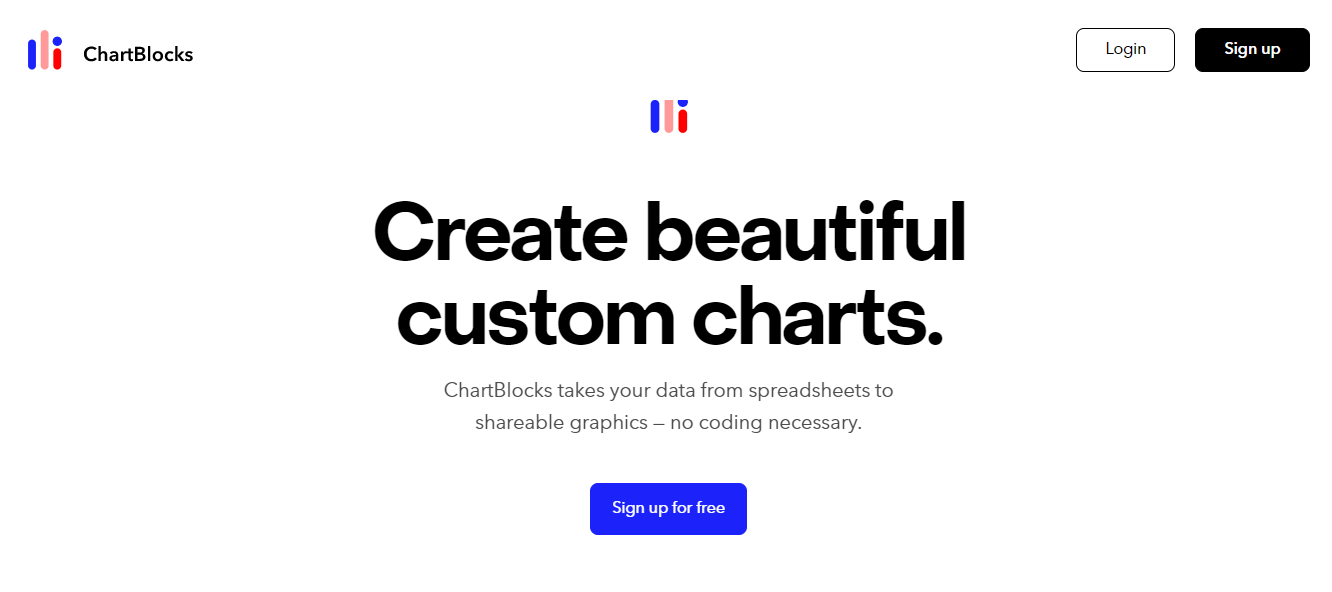
ChartBlocks
It is a cloud-based tool to visualize the data for small to large companies. The platform also contains pre-made templates with different types of charts. Moreover, it has editable colors, sizes, and fonts.
Pros
- Seamless data importation
- Easy-to-use dashboard
- Shareable charts
Cons
- Quite difficult to navigate functions.
- The image is not up to date when downloading the pdf.
Features
- Analytics
- Data Import
- Templates
- Chart Building Wizard
- Social Media Integrations
- Multiple File Support
Pricing
There is also a free version of ChartBlocks with limited access to features. Moreover, two more pricing plans cost $20 and $65 per month.
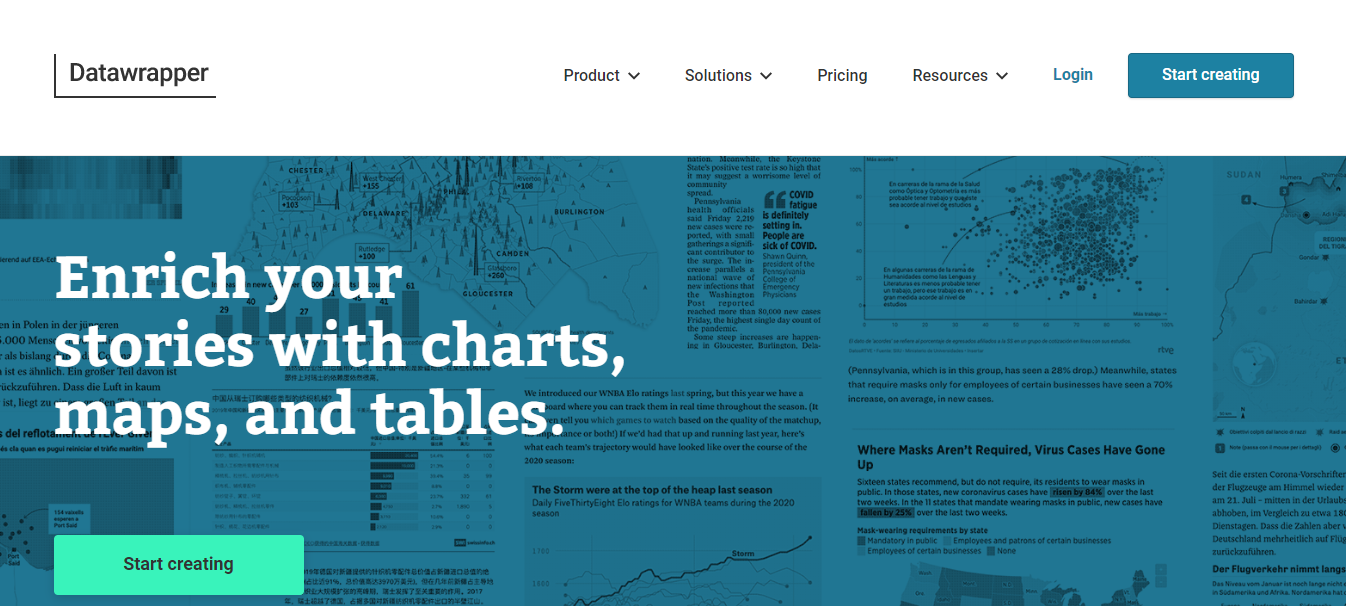
Datawrapper
Datawrapper helps us to compile as well as visualize the data. Moreover, it makes the process easier to visualize a large amount of data. Datawrapper is one of the best charting software for designers, software developers, and journalists.
Pros
- OS Adaptability
- Design Flexibility
- Easy and Simplified UI
Cons
- Limited flexibility
- Difficulty in customization
Features
- Export as PNG, PDF
- Chart type and style choice
- Maps
- Layout customization
- Live chart updates
- Color options
Pricing
Datawrapper offers a free plan just like other charting software. Moreover, we can get a customized plan for premium features.
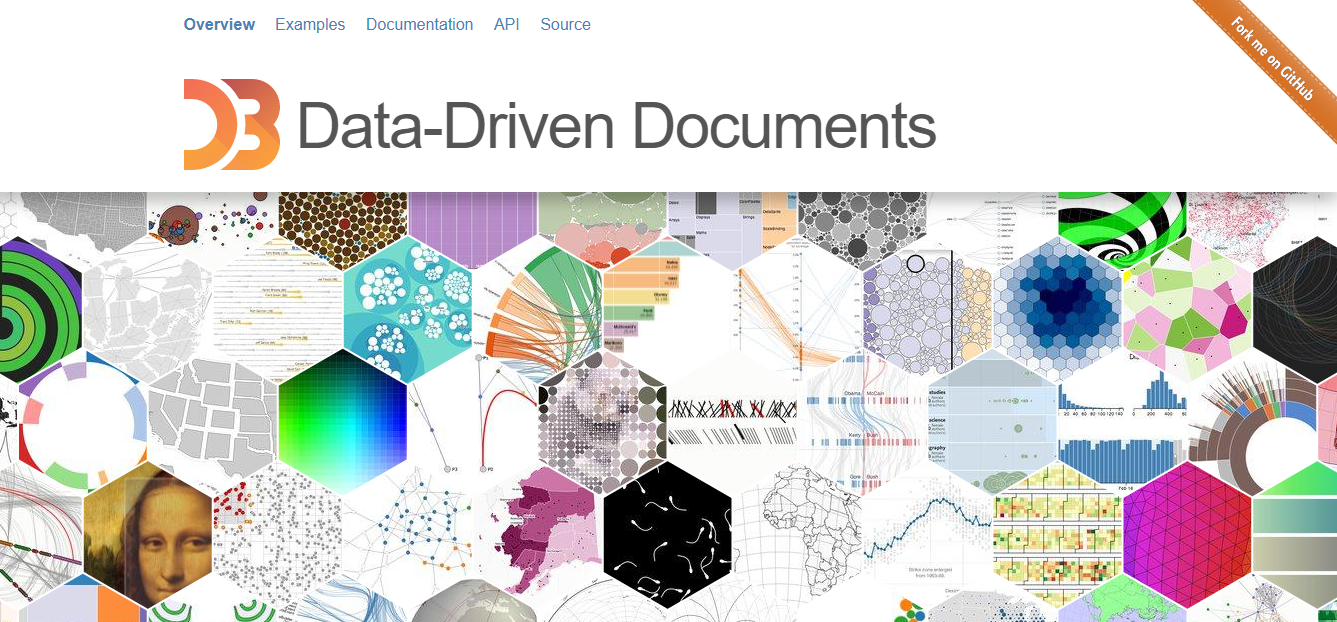
D3.js
D3.js consists of complete tools to visualize the data. Moreover, it is based on the JavaScript programming language. It is important to note that D3 stands for Data-Driven Documents.
Pros
- Massive library of existing works
- Large community
- Adaptable to different web technologies
Cons
- Lack of consistency
- Requires programming knowledge
- Lack of support
Features
- Functions Factory
- Built-in Element Inspector
- Declarative Approach
- DOM Manipulation
- Web Standards
- Voronoi Diagrams
- Curve generating functions
- Dragging
Pricing
D3.js only gives quote-based plans to its users.
Google Charts
It is a free and powerful data visualization tool. Google Charts is a powerful and one of the best charting software that works with dynamic data. We can use it to create interactive charts that are also capable of embedding online.
Pros
- A large variety of charts
- Free
- Works with dynamic data
- Cross-browser compatibility
Cons
- Limited support
Features
- Overlays
- Development Tools
- Word Trees
- Trendlines
- Timelines
- Chart Editor
- Animation
- Data Views
- Data Tables
- Formatters
Pricing
Google Charts is free to use all over the world for its users.
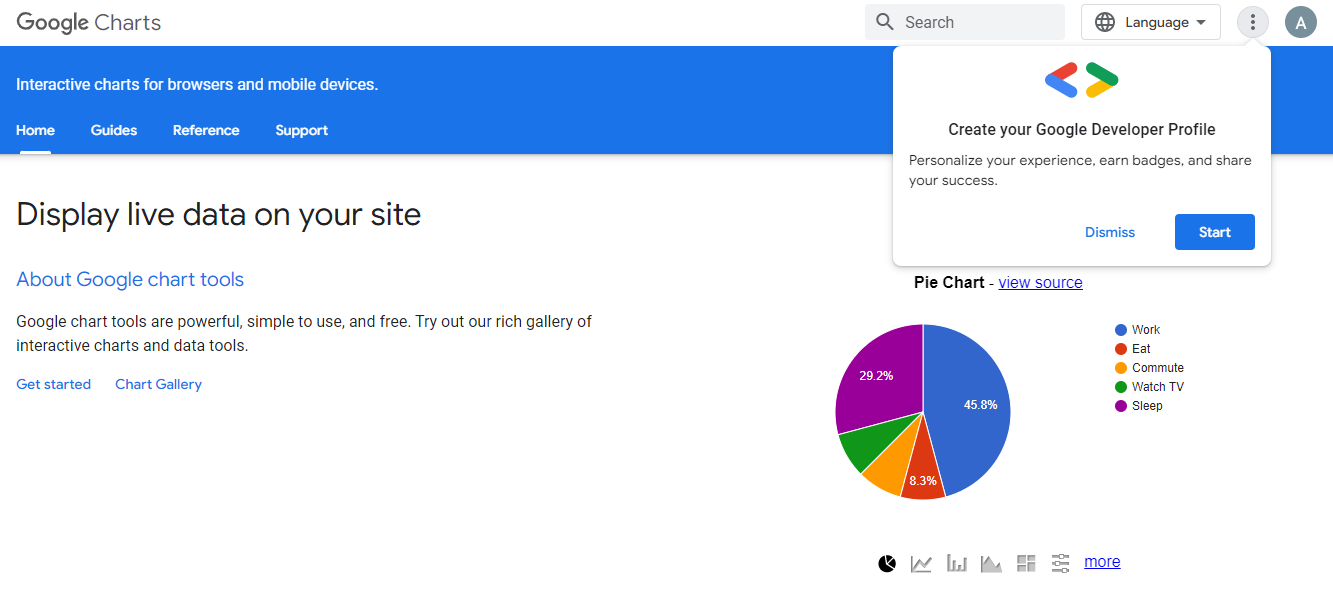
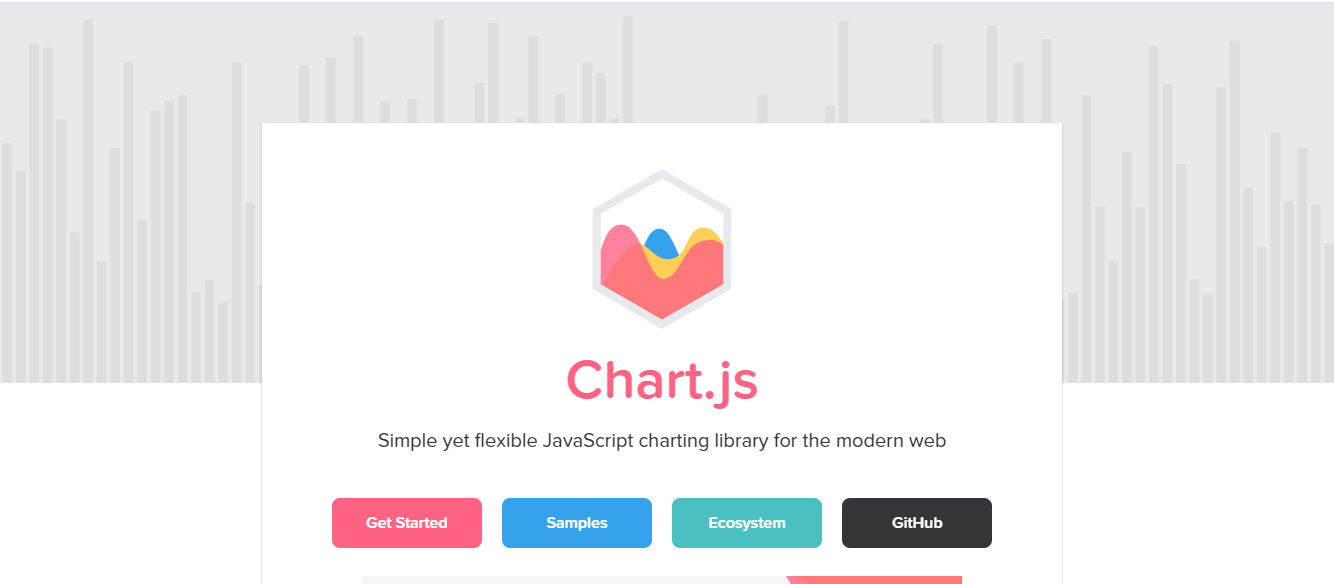
Chart.js
It is a flexible and simple JavaScript charting software. Chart.js is open-source software that provides a large variety of charts with amazing features.
Pros
- Free
- Open Source
- Responsive
- Cross-browser compatible
Cons
- Limited chart types
- Limited support
Features
- Uses HTML5 Canvas
- Cross-browser compatible
- Responsive charts
Pricing
No pricing information has been shared yet.
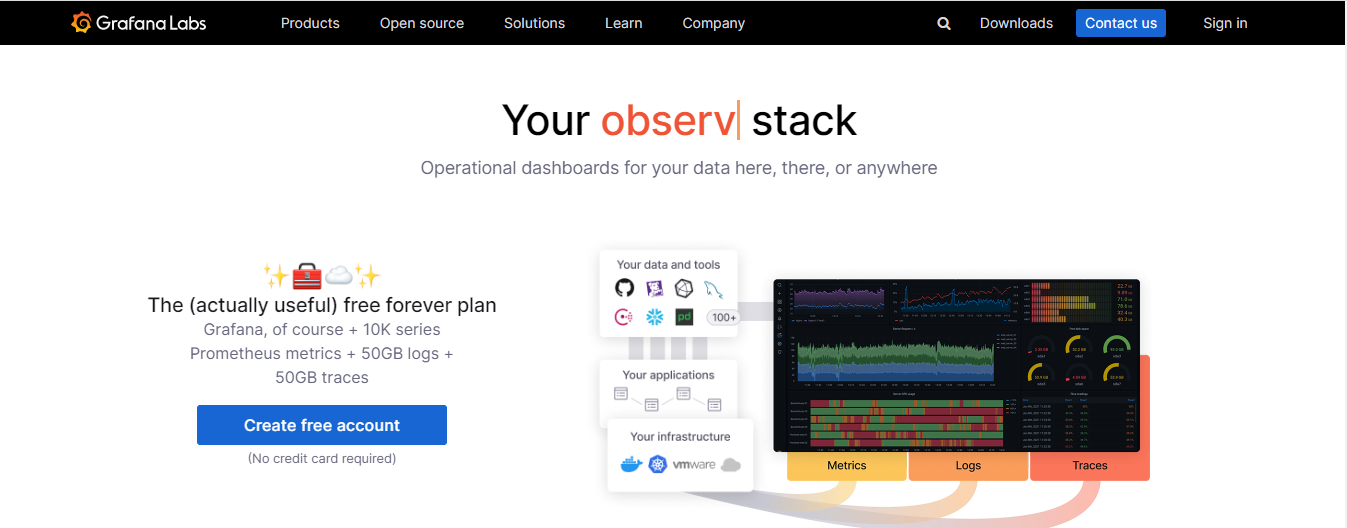
Grafana
It is another open-source charting software to visualize and chart your data efficiently. Moreover, Grafana also helps us to create dynamic dashboards. We can also use hundreds of available plugins in Grafanna.
Pros
- Open source
- Free and paid options
- Variety of chart types
- Large selection of data sources
- Can work with mixed data feeds
Cons
- Limited visual customization options
- No options to embed dashboards in websites
Features
- Dynamic dashboards
- Export functions
- Supports more than 50 data sources
Pricing
It offers a cloud-hosted version at a $49/month rate. Moreover, it also offers a free version.
Chartist.js
This charting software is another tool that helps in creating simple and responsive charts. Charts made from this tool are highly cross-browser compatible and customizable.
Pros
- Tiny file size
- Open source
- Free
- Animated charts.
Cons
- Not so many charts are available
- No mapping abilities
- Limited support
Features
- Animations
- Plugins
- Responsive
- Customizable
- Simple handling
Pricing
Chartist developers didn’t give information for price data.
Sigmajs
It is one of the best charting software that we can use only for single-purpose visualization. Most users prefer this tool for network graphs. Let’s explore its pros, cons, and features.
Pros
- Highly customizable
- Free
- Open Source
- Can easily ember charts in websites
Cons
- Only suitable for network graphs
- Requires JavaScript knowledge to implement and customize.
Features
- Two data formats; JSON and GEXF
- HTML5 Canvas
- Highly interactive
Pricing
The developers of Sigma JS do not share the pricing information.
Polymaps
As the name suggests, this library is specially designed for maps. We get responsive and dynamic maps as output from Polymaps. Here are some of its pros, cons, and features.
Pros
- Good for mapping purposes
- Open source
- Free
- Easily embeds maps on the website.
Cons
- Suitable for only one time of visualization.
- Requires coding knowledge.
Features
- Viewing examples
- Filing bugs
- Support
- Build instructions
- Dynamic and interactive maps
- Visual presentations
- Multi zoom datasets
- Tiled vector data
- Cartography
- SVG compatible
- CSS rules
Pricing
Polymaps is a free mapping JavaScript library.
Best Charting Tools: Conclusion
Now that we have the 12 best charting software or data visualization tools, we can find it easy to get the right tool. It is important to know the requirements of a project before finalizing the charting software. Among all the charts explained above, FusionCharts is comparatively better. The reason is that we can visualize our data in the form of charts and maps.
Best Charting Tools: FAQs
Which Is the Best Site for Charting?
FusionCharts is the best charting software for a variety of use cases. Moreover, there are also other tools for angular charts that can be reliable.
What Is the Best Free Stock Charting Software?
Tradingview free charting app is among the best stock charting software.
What’s Better Than Tradingview?
Good Crypto, Bloomberg, Seeking Alpha, and MarketWatch are some better options.
What Charts Do Professional Traders Use?
Professional traders mostly use candlestick charts.
Sign up for free now to chart your data using the highly reliable charting library.