To create pie charts and generate statistical data, you’ll find this list of the best pie chart makers useful.
Pie charts are popular circular-shaped graphs used to visualize data. They are a critical component of business analysis and help in decision-making for different purposes. Today, there are a plethora of free online tools that take in your raw data and produce meaningful visualizations with minimal effort. Let’s dive right in and see the pie chart makers you should consider.
Table of Contents
What is a pie chart?
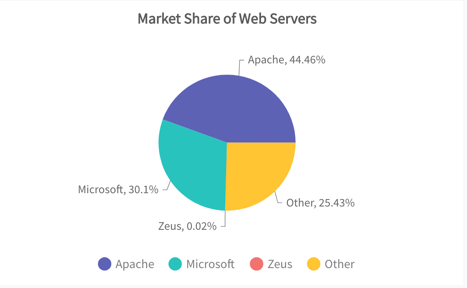
A pie chart is a circular-shaped chart created to demonstrate the part-whole relationship of data variables.
The chart is always rendered in the form of a circle with various slices that represent the categories. The entire circle of the pie chart visualizes the total quantity, while each section represents each variable (or category).
Also, each section’s arc size and length showcase how much of the total quantity the category occupies.Pie charts are an essential element of data-driven analysis. They can be created in minutes using a pie chart maker and deployed to interpret data for various use cases.
5 must-have features in a quality circle chart creator
When selecting a pie chart maker, keep an eye out for these essential features to make sure your charts are not only beautiful but also accurate and practical:
- Intuitive interface: The ideal tool provides users with an intuitive method to generate a pie chart visualization without requiring advanced training. The combination of drag-and-drop features with clear interfaces leads to important improvements.
- Real-time data input & import support: Data import functions in the best tools accept CSV files as well as Excel and Google Sheets, while automatically updating visualizations when data changes occur.
- Design flexibility and customization: Modifying fonts, colors, legends, labels, and slice styles is mandatory to achieve either branding or personalization.
When to use a pie chart
Pie charts are usually appropriate for any scenario where you need to represent categorical variables as percentages or showcase individual sections as part of a whole quantity.
In this case, each categorical variable is represented as a section of the circle and adds up to the total quantity.
Top 10 pie chart makers in 2025
Pie chart makers help you create a pie chart online with little effort.
Here’s a list of the best ones you should consider:
FusionCharts
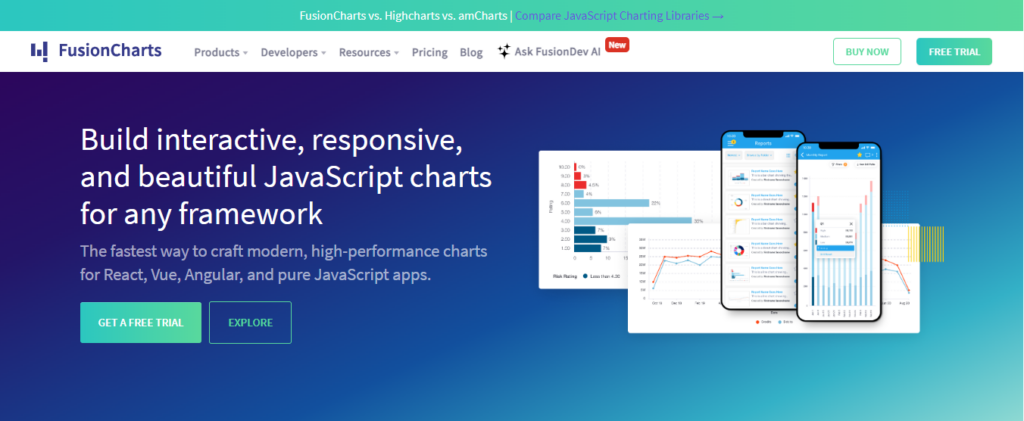
FusionCharts helps you create beautiful charts, graphs, and dashboards for your web or mobile projects.
This JavaScript charting library utilizes a programming language (JavaScript) to generate statistical data from beautiful, interactive pie charts.
Using FusionCharts, you can build easy-to-interpret pie charts in react native, angular, react, vue, and other JavaScript frameworks.
Plus, the library provides 100+ custom-built chart templates to help you get started quickly.
Whether you’re building for mobile or web, you can always leverage ready-to-use pie chart templates (available with source code), plug in your data, customize, and create your own.
FusionCharts is available to small and large businesses, and you can start creating pie charts with a free trial. It also allows full control over pie chart components, so users can improve every visual and functional detail of their charts.
Key features
- Provides an interactive charting experience
- Easily explore specific insights by zooming into time windows on axes.
- Understand data trends using vertical, horizontal, and regression lines.
- Share maps, gauges, and charts in multiple formats, streamlining data sharing
Pros
- FusionCharts Is XML Compatible
- We provide easy customization
- At FusionCharts, there is an availability of animated & interactive graphs.
Cons
- FusionCharts’ UI requires updating.
- Sometimes it is a little buggy
Designhill
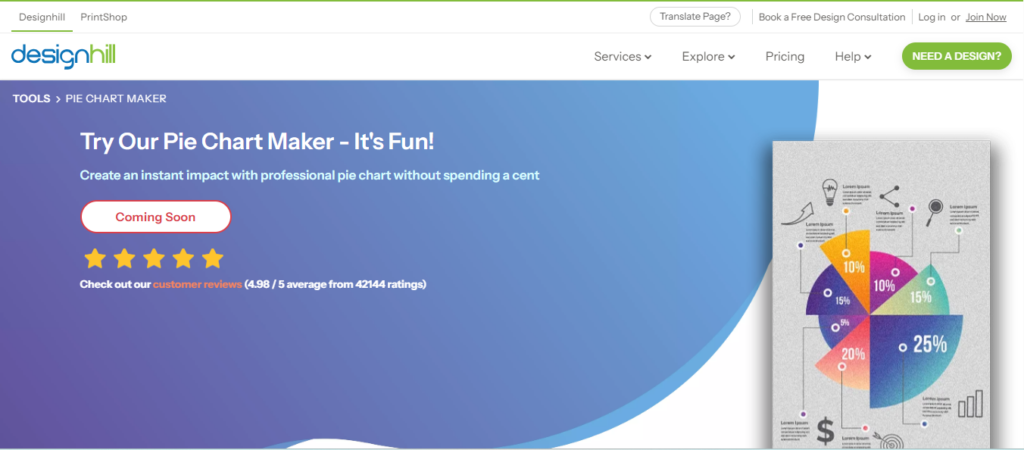
Designhill’s Pie Chart Maker is a free online tool that helps you create beautiful, custom pie charts in minutes.
The online pie chart maker offers a ton of layouts as well as customization options to create pie-doughnut charts, 3D pie charts, and others.
To get started, you only need to plug in your data variables. Then, edit the color, fonts, and photos.
Once that is done, the pie chart generator will generate a beautiful pie chart with sections with arch lengths corresponding to the variable represented.
That’s it. No professional design skills are needed to use the tool.
Designhill’s Pie Chart Maker is free to use. You can also use the platform to easily create pie chart visuals for enhanced presentation value.
Key features
- Intuitive interface for easy pie chart creation.
- Customization options for colors, labels, and other elements.
- Easy export in PNG, JPEG, PDF, and SVG formats.
Pros
- User-friendly interface for non-designers.
- Budget-friendly pricing options.
- Access to a global network of designers.
Cons
- Only supports pie chart creation.
- Limited advanced features in the free version.
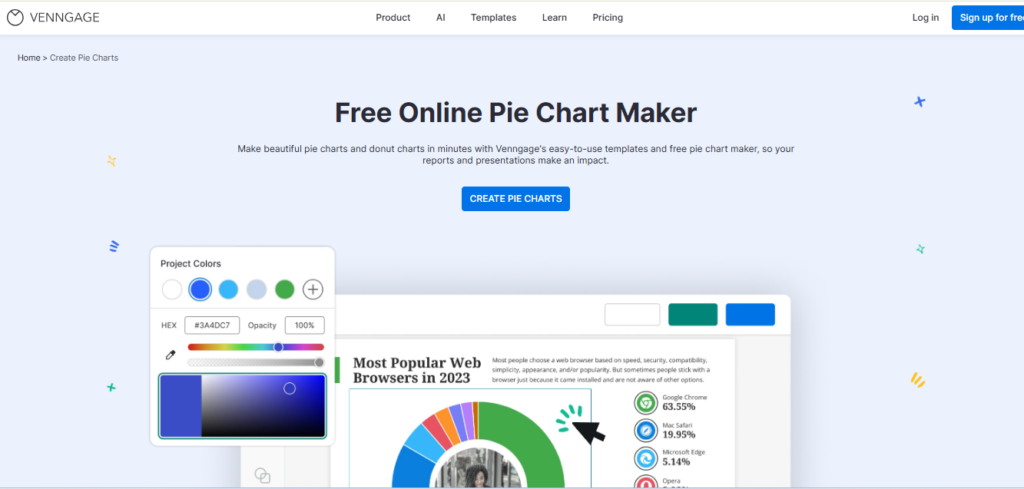
Venngage
Key features
- Built-in data table with live updates as values change.
- Multiple pie chart styles, including donut and segmented layouts.
- Custom color, label, and font controls for clearer data emphasis.
- Drag-and-drop icons, illustrations, and images to add context
Pros
- Strong visual customization compared to basic chart tools.
- Easy to keep pie charts on-brand across multiple documents.
- PowerPoint export works well for decks and client reports.
Cons
- Advanced export options require a paid plan.
- Limited to standard pie and donut chart formats.
Visme
Visme offers a free and easy-to-use tool dedicated to creating visually appealing, professional pie charts.
The pie chart generator allows you to generate pie charts in a few minutes. You can use several chart customization possibilities to make your visualization process as painless as possible.
Plus, you also get access to a library of attractive design templates to get off the ground fast.
To begin, you can plug in your project data manually. Or, if you’ve created a pie chart in Excel, you can simply import it into the Visme graph engine.
Then, add the data points, customize fonts or colors, and indicate data labels. Thanks to its templates and drag-and-drop widgets, you don’t need professional design skills to jumpstart. Visme is free to use, and you can get started by signing up using your social media account. You can also create pie chart visuals easily by combining templates, colors, and animations for a more impactful presentation.
Key features
- Enhance user engagement with captivating 3D objects.
- Ensure data security with robust access controls and permissions.
- Monitor user interactions with an intuitive activity dashboard.
- Add dynamism to your platform with seamless animation integration.
Pros
- Streamline content creation process
- Intuitive user interface for ease of use
- High-quality design elements for enhanced visual appeal
Cons
- Potential design flaws affecting usability & aesthetics
- Restrictions on tailoring the product to individual preferences
RapidTables
RapidTables is an online pie chart maker available to generate statistical data.
It offers a straightforward process to rapidly create a simple pie chart and get going. This tool is best for you if you’re on a limited time.
One downside to using RapidTables is that it offers limited customization options and no pie chart templates.
To get started, choose the chart type you want to create, and enter your chart title, data labels, and data values. Then, draw the chart.
RapidTables is completely free to use and does not require you to sign up. While it is not a full-featured pie chart generator, RapidTables offers basic functionality suitable for simple visual needs.
Key features
- Wide range of calculators (math, physics, chemistry, engineering)
- Unit converters (length, weight, volume, temperature, etc.)
- Interactive charts and graphs
Pros
- Accessible without any cost and budget-friendly for all levels of users
- Diverse tools for STEM field calculations
- Interactive visual aids for better data understanding
Cons
- Limited chart customization
- Ads may disrupt the experience
- Lacks advanced features
Visual Paradigm
Visual Paradigm is an online free chart maker that drives easy and seamless data visualization.
With this tool, you can edit any beautiful pie chart template in an intuitive spreadsheet editor and customize them to your desire.
Visual Paradigm allows you to make your chart beautiful by editing its fonts, colors, labels, and icon legend. Millions of stock photos and icons are available on its spreadsheet editor to spice up your design.
Visual Paradigm is free to use, and you can get started building pie charts with it in minutes. You can also create pie chart visuals to enhance the dimensional appeal of your data presentations.
Key features
- Supports UML, BPMN, ERD, and other diagram types
- Enables team collaboration with discussions and version control
- Offers requirement management tools throughout developme
Pros
- User-friendly interface for all skill levels
- Wide range of modeling tools including UML, BPMN, ERD diagrams, and more.
- Strong collaboration features for team discussions, reviews, and version control
Cons
- Steep learning curve for beginners
- Some features need extra training
- Limited support for certain languages
HighCharts
Highcharts is a versatile data visualization tool offering various chart types, including line, bar, pie, and scatter plots. Its intuitive interface allows seamless interaction with charts, while responsive design ensures device compatibility. Extensive customization options enable users to tailor charts to their needs, from styling to advanced features like animations.
With robust documentation and support resources, implementation is smooth, and troubleshooting is simplified. Highcharts stands out for its user-friendly interface, rich feature set, and strong community support, making it an outstanding option for businesses looking to improve their data visualization capabilities with pie chart maker.
Key features
- Supports multiple chart types (line, bar, pie, scatter).
- Responsive design for all devices.
- Detailed documentation and support resources.
Pros
- Fast rendering, even with big data.
- Strong user and developer community.
- Easy-to-use, customizable interface.
Cons
- Limited support on older browsers.
- Paid license needed for commercial use.
AnyChart
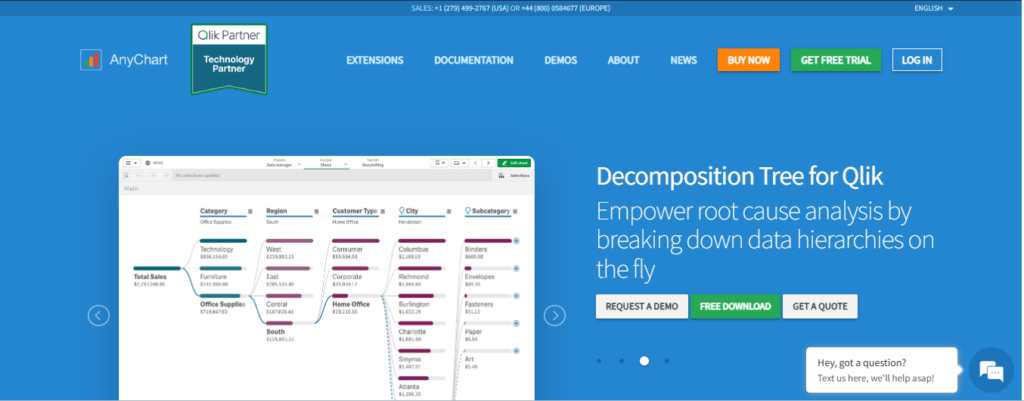
AnyChart is a comprehensive charting solution offering various features to create visually appealing and interactive charts. With AnyChart, users can quickly build charts, including lines, bars, pie charts, scatter charts, and more, suitable for diverse data visualization needs.
One of its key features is its flexibility, allowing customization of every chart aspect, including colors, fonts, and labels. Additionally, AnyChart supports interactivity, enabling users to add tooltips, drill-down functionality, and interactive legends to enhance user engagement.
It also serves as a robust pie chart maker, helping users add depth and visual appeal to their circular data visualizations.
Key features
- Advanced JavaScript API
- Supports ASP, PHP, ColdFusion, Perl, and more
- Cross-platform and cross-browser compatibility.
Pros
- Wide variety of chart types for easy data visualization
- Interactive elements like tooltips and drill-downs
- Easy integration with web, desktop, and mobile apps
- Free from dependencies
Cons
- Steep learning curve for full feature set
- Full version can be costly for small users
Meta Chart
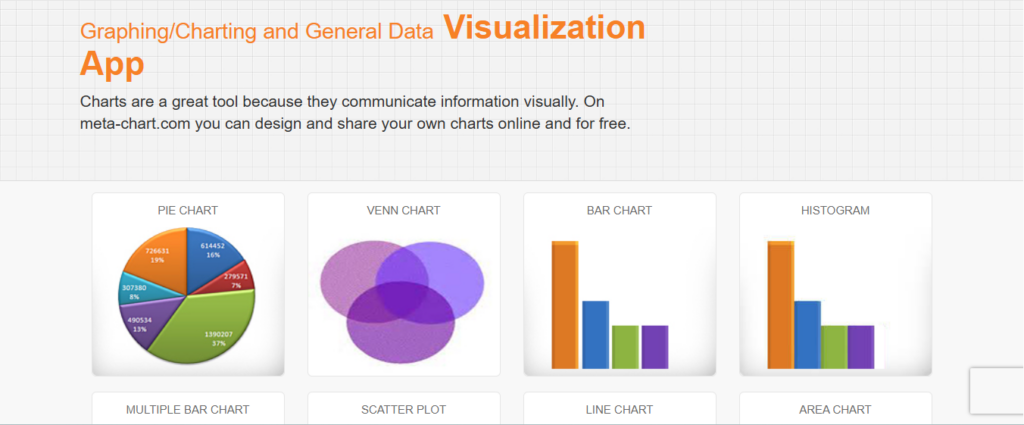
Meta-Chart offers an excellent solution for creating pie charts. With this pie chart maker platform, users can quickly input data and generate pie charts that clearly depict the proportions of different elements. Its straightforward approach is ideal for users who value simple and effective data representation.
Key features
-
- Offers various chart types (bar, line, pie, etc.)
- Customizable colors, fonts, and styles
Real-time collaboration for teams
Pros
- Intuitive and user-friendly interface for all skill levels
- Suitable for business presentations, education projects, and data analysis
- Supports real-time remote team collaboration
Cons
- As a pie chart generator, it lacks advanced rendering features.
- Limited customization options
- Requires internet access
- Potential cloud data privacy concerns
ChartGo
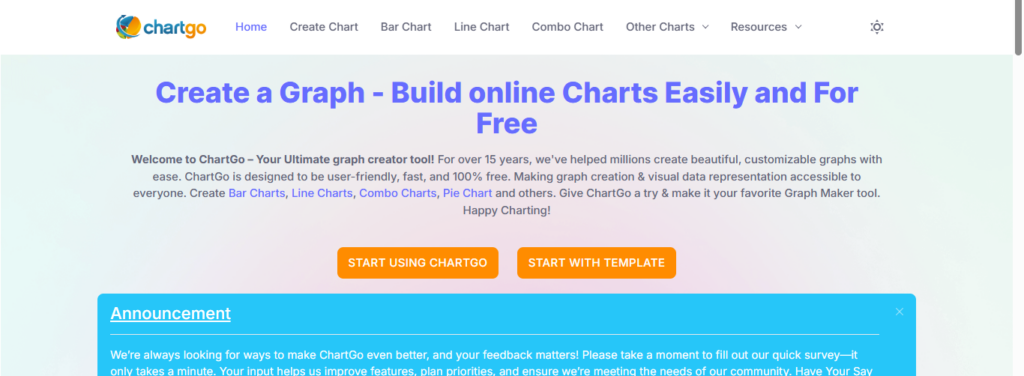
For easy chart creation, chartGo provides an interface that will help in creating the charts online. Educators and students, together with other users who require a simple chart solution, find this tool exceptionally convenient, especially when adhering to pie chart best practices like proper labeling and color schemes.
Key features
- Offers a diverse type of charts(bar, line, pie, and area)
Pros
- User-friendly interface, making it ideal for non-technical users
- No subscription is required, allowing users to log in and start working immediately
Cons
- Not include advanced statistical analysis
Displayr
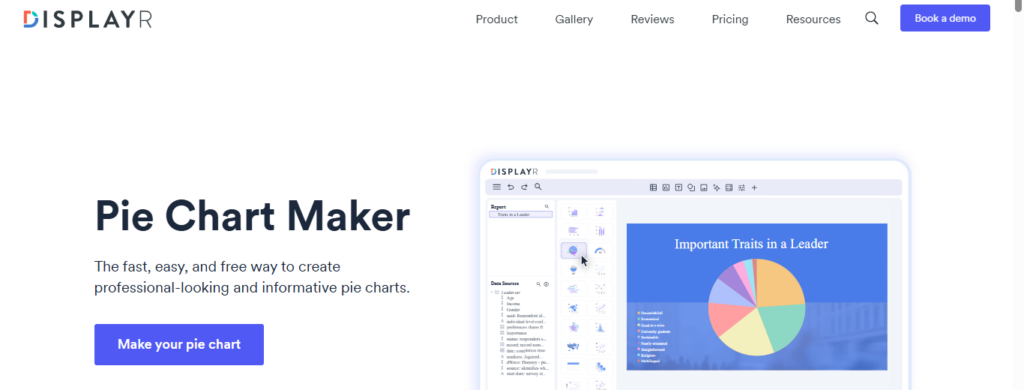
Displayr is a fast, easy, and free way to create professional-looking and informative pie charts. Data analysts, together with researchers who seek detailed insights, will find the best solution in the Displayr pie chart maker.
Key features
- Offers advanced data analytics, data cleaning, and interactive dashboards for tasks like brand analysis and KPI tracking
Pros
- Provide offline and real-time data connection with popular data collection platforms.
Cons
- Slow processing speeds at times
What are the other pie chart maker tools in 2025?
Here are some other pie chart maker tools which you can also consider:
Canva

Although Canva earns its reputation for graphical design tools, it also excels at creating pie charts in less than a minute. As an easy pie chart generator, the user-friendly interface with drag-and-drop function enables quick creation of pie charts to prepare content for presentations, infographics, and social media graphics. It offers 20+ chart types and hundreds of templates, making it great for users with no design experience. Additionally, its Magic charts feature allows you to embed them directly into your design, and AI can be used to generate realistic images. However, Canva’s editing tools are somewhat restricted, limiting customization options for advanced users.
Infogram
Infogram comes with some impressive visualization tools powered by AI, including charts, maps, reports, and more. Web content users benefit most from this software since it excels at presenting interactive charts and graphs along with maps. The feature helps achieve the purpose of pie charts by effectively showing various sections of the complete picture in an easy way. It offers 35 charts and 800+ map types with different styles. It is easy to use and provides 200+ customizable Infogram templates for different styles, such as ocean sand, flow light, etc. However, when working with large datasets, there is a risk of data loss.
Chartify (by Spotify Design)
Chartify is an open-source tool that lets you instantly turn your raw data into charts. You can simply drag and drop the file and apply the filter to create the chart within seconds. As an easy pie chart generator, its main emphasis lies on typography, together with spacing and visual harmonization. The system automatically generates the SQL query and shows the chart instantly. Integration with Google Sheets, allowing direct import of data into the graph. However, it lacks interactive features, offers a limited range of chart types, and does not support direct data input.
Piktochart
For transforming complex ideas into attractive visuals that help in engaging and informing the audience. With Piktochart AI, users can design infographics alongside reports and presentations within seconds that are perfectly associated with your brand. It provides a visual pie chart maker that functions perfectly as part of infographics or slide decks. The platform offers a simple user interface. However, it cannot handle large datasets, which may limit its use.
How to create a pie chart: Step-by-step
Producing a pie chart requires minimal effort with the available tools. These steps will help anyone create a data visualization chart without difficulty.
Step 1: Choose your pie chart tool
Your visualization design tools consist of FusionCharts, Google Sheets, Canva, and Designhill to match either speed needs or professional outcome requirements.
Step 2: Data input
Provide the categories followed by their numerical values. The data should consist of whole parts that combine to equal 100%.
Step 3: Customize the design
You should modify the color scheme together with fonts and labels while changing the position of the chart segments. Your chart will become more comprehensible through properly placed legends and labels, which are important for interpreting pie charts.
Step 4: Preview and adjust
Review your pie chart. The placement of your data slices by size order assists viewers in grasping the information more efficiently.
Step 5: Export or share
The application allows you to get your visuals as images or SVG files and creates embed codes for website incorporation or presentation use.
Common mistakes to avoid while making a pie chart
The process of creating pie charts involves many risks of error despite the availability of useful tools. Here are the most common mistakes and how to avoid them in your data visualization chart:
- Too many slices: A viewer becomes overwhelmed when too many categories try to fit within one single chart. A clear visual requires you to keep the number of slices between 5 and 7, maximum.
- Inaccurate proportions: Your data must contain accurate values, which should be properly adjusted for scale. Small errors within values can create wrong interpretations of what your data truly expresses.
- Using for aesthetic appeal: Avoid data visualization effects unless absolutely necessary. Purposes that utilize effects cause visual distortions, which also diminish the ability to see things clearly for effective comparison.
What are AI pie charts in 2025?
AI pie charts are visuals generated or enhanced using artificial intelligence. Here’s how they work and why they’re becoming the new standard:
- Automatic data parsing: AI systems provide a capability to interpret raw data while cleaning it to create segments that are ready for chart presentation. This helps with interpreting pie charts quickly and accurately.
- Smart labeling: This system allows artificial intelligence to propose label items and legend elements, as well as tooltip text, through the detection of standard patterns and terminology.
These technological advancements enable both non-designers and save time by eliminating manual work to produce a compliant pie chart application within seconds.
The future of pie chart generators
The development of pie chart makers continues at a rapid pace, where FusionCharts stands out as the leader. The creation of charts becomes both speedier and wiser through integrations of natural language commands together with AI-driven design assistance. When you use real-time automated data collection, your data visualization chart remains automatically updated. Cloud collaboration allows teams to work together live, and accessibility features such as voice and keyboard enable every participant to join the process. The future is designed through FusionCharts, which has an intuitive interactive system that continually advances.
The Best Way to Use A Pie Chart
Here are some best practices you should follow when creating a pie chart to generate statistical data.
Use Annotations
Tiny fractions and proportions will be challenging to interpret from a pie chart.
This is why annotations and data labeling are best practices. You should add data labels to your sections and also create an icon legend, where possible, so your audience can smoothly understand your chart.
Slice Size & Order Matters
When creating pie charts, it’s best to arrange the categories according to their contribution to the whole quantity.
You can do this by placing the largest slice at the top-right corner and arranging the rest in descending size order, from right to left.
Arranging the slices in your chart properly will make it easy for your audience to interpret.
Specify a Maximum Number of Pie Slices
Pie charts with plenty of slices would be challenging for your audience to interpret.
When creating your pie chart, you should represent a minimal number of categories in the circle. A good range has five to ten categories.
Use Less Distortions & 3D Visual Effects
Excessive 3D visual effects can distort your custom pie chart and make it less readable.
So you should completely avoid these distortions, and visual effects, or ONLY use them when necessary. If your goal requires a stylized appearance, consider using a reliable Pie graph maker that balances visual appeal with clarity.
Why FusionCharts?
FusionCharts stands out for its dependability, simplicity, interaction, and customization.
The JavaScript library offers you the right tools to build beautiful and interactive charts, graphs, and dashboards for the web or mobile.
Here are some reasons why 800,000+ developers use FusionCharts and why you should. Compare top solutions now!
Supports 100+ Chart Types
FusionCharts works with over 100 interactive chart types and 2000+ data-driven maps and offers popular data charts such as Pie, Bar, Column, Line, and Area charts. And you get access to domain-specific charts such as Treemaps, Heatmaps, Gantt Charts, Marimekko Charts, Spider Charts, and Waterfall Charts.
Over 2000+ data-driven choropleth maps, which cover countries, counties, and even cities, are also available in FusionCharts. It empowers users to conduct effective pie chart analysis by allowing deep customization and interactive data exploration.
Plenty of Customization Options
FusionCharts makes editing your charts and graphs easy thanks to its numerous customization possibilities.
Every theme in the library can be customized to its tiniest bits to achieve the modern look and feel you desire.
You can also customize elements on your pie charts, such as data labels, captions, axis labels, icon legends, and data points to suit your visual needs.
Supports Chart Interaction Features
FusionCharts makes creating interactive and responsive charts and maps easy, so your audience can have a better, user-friendly experience.
The library supports interactive features such as panning, zooming, scaling, and dragging. These interactive capabilities enhance pie chart analysis by helping users drill down into data for deeper insights.
Conclusion
In summary, pie charts are an important element of business analysis. They are an exciting way to communicate visually and illustrate data that adds up to 100%.
Creating them has never been easier, thanks to several online pie chart makers: FusionCharts, Designhill, Visme, RapidTables, and Visual Paradigm.
Some of these online tools have free versions and support a lot of layouts, chart types, and desired features. That said, Fusioncharts rises above the herd to focus on meeting your project needs. Download a trial today to get started.