Data is undoubtedly a critical asset of any company. It helps businesses understand their customers, improve performance and make informed decisions. However, manually drawing actionable insights from raw data is quite challenging. This is where you need charts and dashboards for data analysis. Charts are essentially data visualizations or graphical representations of your data. Dashboards are made using multiple charts and graphs, such as pie, bar, line, and column charts. They allow us to make sense of our data, track key performance indicators (KPIs) and inspect business performance, identify trends and patterns, understand customer needs, and make data-driven decisions. Hence, charts and dashboards have become must-have tools for all types of businesses. However, since businesses collect loads of data from multiple sources today, it’s essential to perform cross-platform analytics and create cross-platform dashboards.
In this article, we’ll discuss what cross-platform dashboards are and why they are essential. We’ll also show you the best tools to create such dashboards.
Table of Contents
What Are Cross-Platform Dashboards?
Before we discuss cross-platform dashboards, let’s first discuss what a dashboard is.
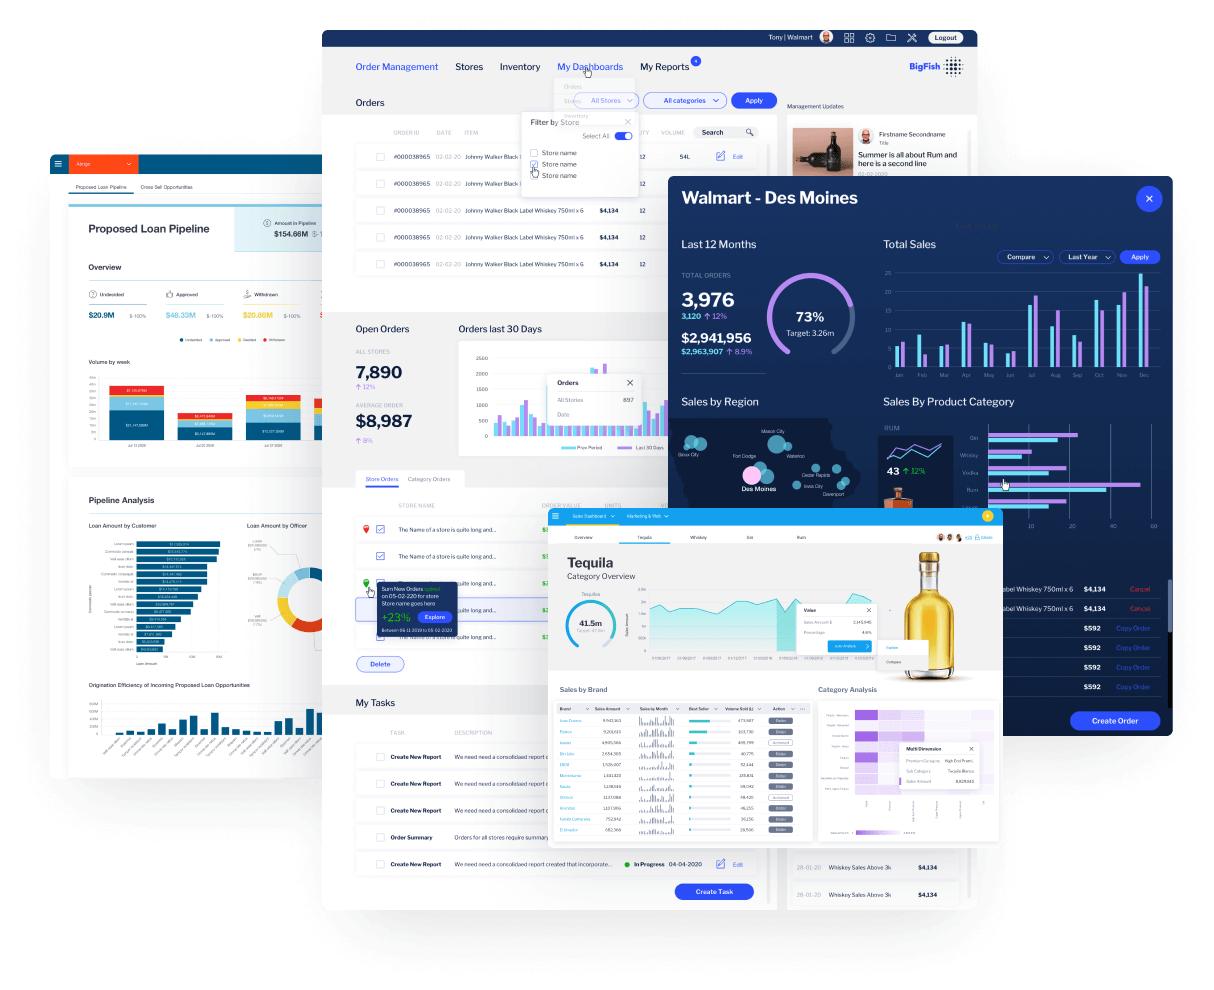
A dashboard consists of multiple real-time data visualizations, such as graphs, charts, and maps, on a single screen. In other words, a dashboard displays data visualizations in a single view, making it to understand, analyze, and track business performance. The visualizations in the dashboard represent critical business data, KPIs, and metrics. For example, if you’re making a financial dashboard, you can include metrics like net profit margin, gross profit margin, and price-to-earnings ratio. However, since businesses collect data from multiple platforms today, it’s critical to create cross-platform dashboards.
Cross-platform dashboards are tools that enable businesses to access and manage data from several sources in one centralized location. They provide an easy way to visualize and analyze data from several sources in one place. You can use these dashboards to monitor performance metrics using performance data, track customer behavior, and gain insights into business operations.
Cross-Platform Dashboard Example
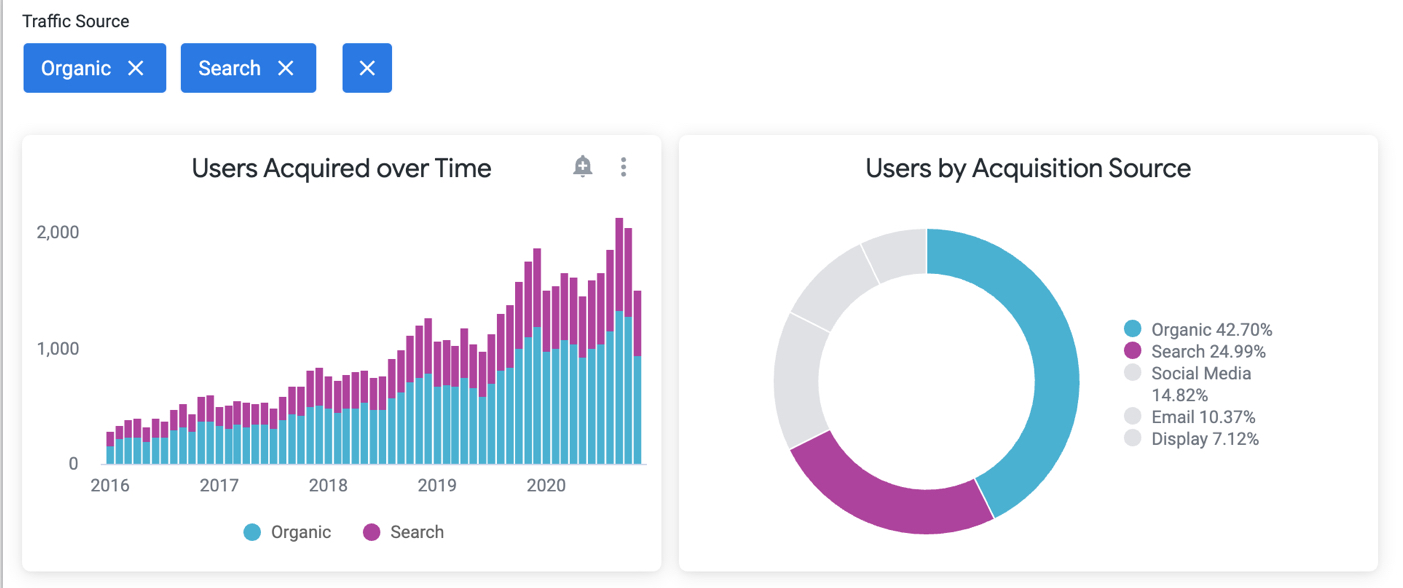
An example of a cross-platform dashboard is a cross-platform marketing dashboard that allows you to analyze user behavior data from several marketing platforms. In other words, you can create a cross-platform marketing dashboard to track users and customer behavior on multiple channels and mobile apps.
For example, you can include data from social media sites like Facebook, Twitter, and Instagram and track metrics like click-through rates, social media reach, conversion rate, etc., for each platform. This data can be gathered through APIs or scraping tools that collect relevant insights from different platforms when direct integrations aren’t available. This will allow you to understand which social media marketing campaigns are providing the best results and adjust the other campaigns accordingly. Hence, cross-platform dashboards allow you to measure the success of your marketing campaigns on several platforms.
A good dashboard should consist of real-time data visualizations so that you get the most up-to-date data. Additionally, dashboards should be interactive, allowing users to zoom in/out, scroll charts, and more.
What Are the Advantages of Cross Platform Dashboards?
Here are the main advantages of using a cross-platform dashboard:
Unified View of Data From Various Sources
A cross-platform dashboard combines data from different sources and platforms, providing a unified view of data. This way, users can quickly and easily get the information they need. These dashboards also make tracking the performance of the business easy.
Detailed Analysis/Cross-Platform Analytics
These dashboards allow us to analyze performance on various platforms individually and in-depth. We can also compare performance on different platforms and make adjustments accordingly. For example, if you use images, videos, and text to promote your products on different social media platforms, you can create cross-channel marketing dashboards to track user behavior and see what content your customers like the most.
Ease of Use
A properly designed cross-platform dashboard is user-friendly, allowing users to understand and interact with their data quickly.
Increased Efficiency
Since cross-platform dashboards allow users to access the customer data they need instantly, they help reduce the time it takes to analyze data and improve the user journey.
Cost Savings
Another key benefit f using a cross-platform dashboard is that businesses can save costs by eliminating the need to use several software solutions and marketing tools.
What Are the Best Tools for Creating Cross-Platform Dashboards?
FusionCharts
FusionCharts is a powerful data visualization and analytics platform for creating attractive, interactive, and customizable JavaScript charts and dashboards. It comes with various pre-built dashboards templates and allows users to quickly and easily access, analyze, and report on data from multiple sources. Additionally, it provides an intuitive interface that enables users to create interactive charts, graphs, and tables in minutes. With the drag-and-drop functionality of FusionCharts, it’s super easy to customize your dashboards with the data you need. FusionCharts also allows users to create a collaboration dashboard where multiple users can add comments on the visualizations without leaving the dashboard.

Yellowfin
Yellowfin is a popular BI tool with advanced data analytics capabilities that go far beyond traditional dashboarding. With Yellowfin, you get user-friendly, action-based dashboards, automated data discovery, business monitoring, and data storytelling capabilities all in one single platform. Its sophisticated features like Guided NLQ (Natural Language Query), embedded BI and analytics, and Yellowfin Present make it a perfect data analytics platform for enterprises. Moreover, Yellowfin’s Signals and Alerts features provide timely notifications regarding any statistically significant changes in business data. The best thing about Yellowfin is that it’s designed to be accessible for both non-technical business professionals and technical users.
Try Yellowfin and create your own beautiful, interactive, and augmented dashboards.
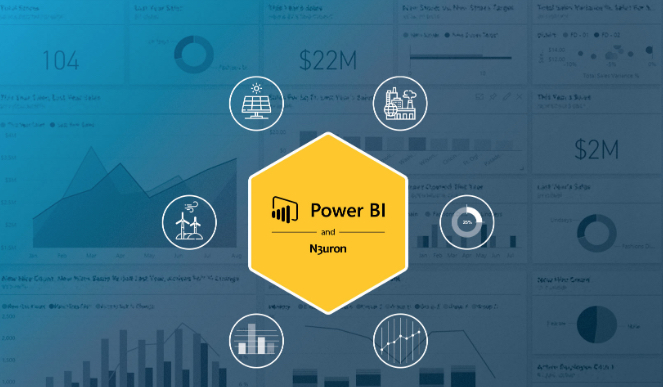
Microsoft Power BI
Microsoft Power BI is a popular cloud-based business analytics platform that focuses on business intelligence. It provides interactive visualizations and insights into data and allows users to access data from multiple sources, including Excel, SQL Server, and Azure. Power BI’s most liked features are its intuitive user interface and the ability to integrate with other Microsoft products easily.
Tableau
Tableau is another widely used data visualization tool that enables users to quickly create interactive and informative dashboards. It supports numerous data sources, such as Excel, SQL Server, and Oracle, and allows users to make the most of their data. Additionally, it offers several collaborative features, allowing users to communicate and exchange data in real-time through dashboards and visualizations.
Looker
Looker is a cloud-based business intelligence platform for creating interactive dashboards quickly and easily. It allows you to integrate data in your dashboards from different data sources, including PostgreSQL, MySQL, and Amazon Redshift.
Hurree
Hurree is an efficient cross-platform dashboard that you can utilize to access and manage data from multiple sources in one centralized location. It offers a quick way to unify and visualize and analyze data from different tools in one place. Some of the notable features of Hurree include real-time analytics, a drag-and-drop interface, automated insights, and custom dashboards.

Conclusion
Cross-platform dashboards enable businesses to access and manage data from different sources in one centralized location. These dashboards provide a quick and simple way to visualize and analyze data from various sources in one place. Some of the best tools for creating cross-platform dashboards include FusionCharts, Power BI, Tableau and Hurree. However, FusionCharts is the leading solution with its sophisticated features, such as over 100 different chart and graph types, several pre-built dashboards, interactive features, and more.
Frequently Asked Questions (FAQs)
What Are the Key Features of a Cross-Platform Dashboard?
When selecting a cross-platform dashboard, you should look for features like real-time analytics, drag-and-drop functionality, automated insights, and custom dashboards. It’s also important to ensure that the dashboard supports multiple data sources so that you can instantly access the data you need.
What Are the Benefits of Using a Cross-Platform Dashboard?
A cross-platform dashboard provides a unified view of data from different platforms and lets you deeply understand your users’ behavior. For example, you can see which users are moving from your desktop app to your mobile site.
How Can I Get Started With a Cross-Platform Dashboard?
To get started with a cross-platform dashboard, you must choose the right solution for your needs. Then you can start setting up your dashboard and adding your desired data sources. Most solutions offer tutorials and support resources to help you get started quickly and easily.
Download FusionCharts and create cross-platform dashboards today!