The FusionCharts team has been hard at work reviewing and updating the product roadmap for the next year. We’ve talked to a lot of customers, conducted product surveys, and used your feedback to shape this roadmap. I hope you’re as excited as we are about our plans!
In this post, we will share roadmap updates as well as our plans for the calendar year 2020 and beyond for our Data Visualization Tool. We hope you will stick with us in the coming years and continue to support us.
Table of Contents
2020 in Review
Before we dive into the roadmap details, we wanted to take a few minutes to recap what we’ve delivered so far this year. It was a fantastic year for FusionCharts as we became a part of the Idera family. Earlier this year, we released FusionTime 2.0 with real-time data support. FusionTime lets you plot them in real-time and stay up-to-date whether you are visualizing stock market data or sensor readings. We also introduced three new charts: Sankey, Chord, and Sunburst. With these charts, you can visualize flows and relationships more elegantly. We also made a few changes in our legend engine to make it highly flexible to move across the canvas. In FusionTime, we introduced time-axis clipping so that you can skip the null data. For example, in the case of stock markets, weekends can be skipped automatically.
Ready to jump into the roadmap details? Here we go!
Roadmap Themes
The CY2020 roadmap focuses on the following five themes:
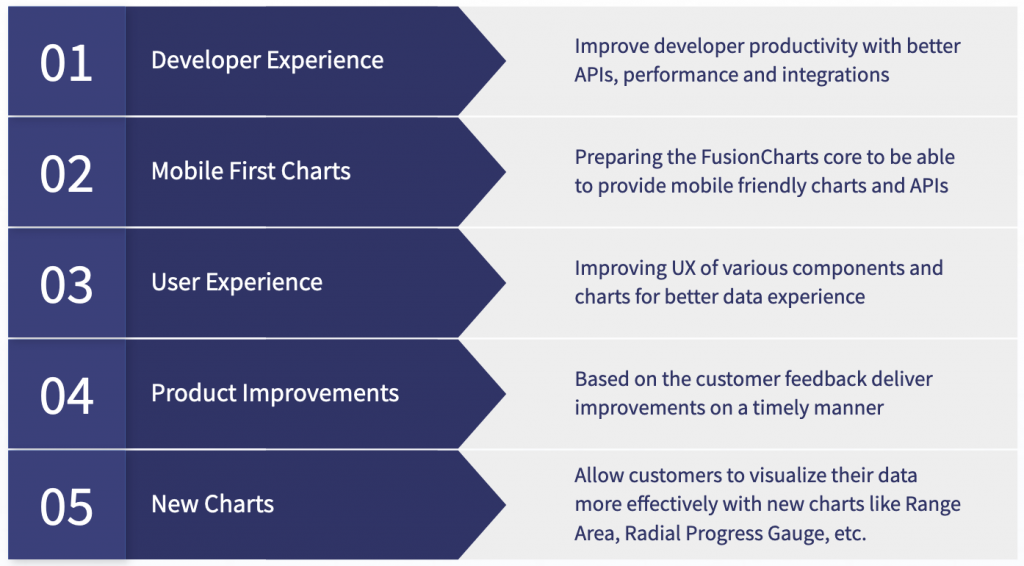
Let’s quickly understand what each of these themes means to you:
- Developer Experience: Developer experience is focused on providing a best-in-class experience to developers working with FusionCharts. We will be focusing on developer productivity with better APIs, documentation, integrations for the choice of framework, etc.
- Mobile-first charts: FusionCharts has always provided responsive charts, but we will be going a step further. We will be offering more ways to customize how your charts look based on the device and viewport.
- User Experience: We will improve the overall experience of chart interfaces and components. These improvements will enable your customers can make data-driven decisions in your applications with ease.
- Product Improvements: These improvements are highly influenced by your inputs. Feedback shared with us during surveys, interviews, and support interactions will be considered as part of this.
- New Charts: We will be introducing a few new charts to ensure that you can have the best experience possible on all devices regardless of the size of the data.
Overall Roadmap
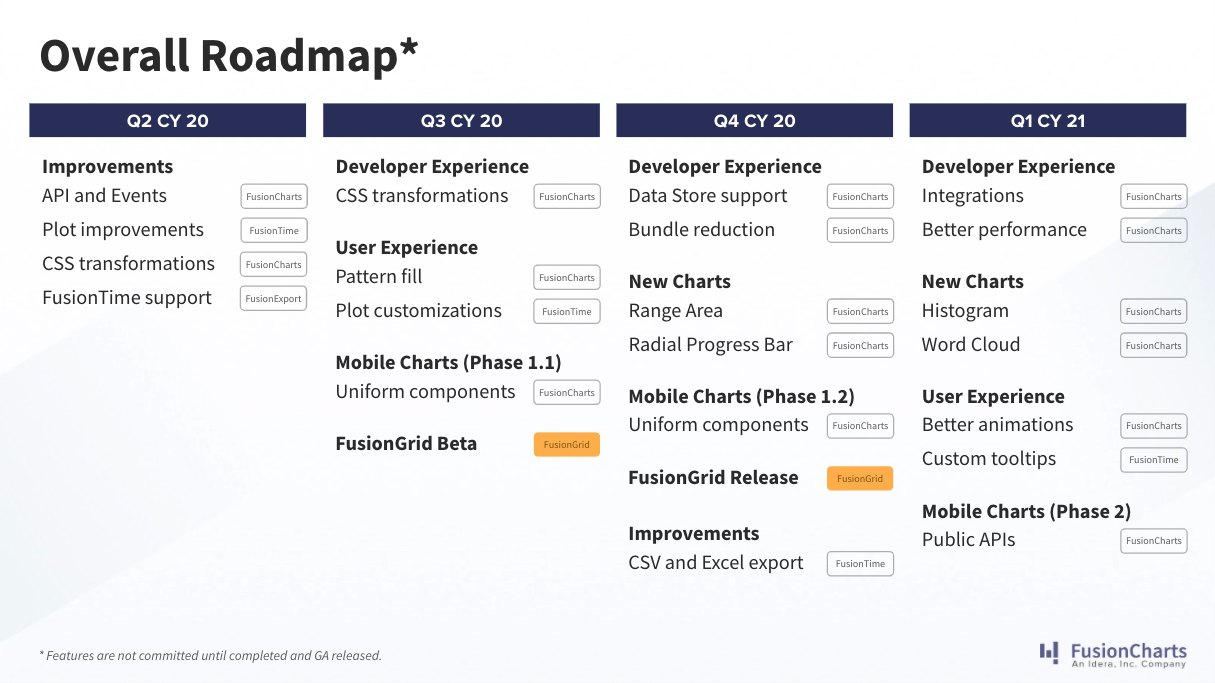
If you participated in the recent FusionCharts customer survey, you probably saw that we plan to release a new product for grids. We are planning to release a beta in the third quarter of this year. If you are interested in joining the FusionGrid beta, please contact your FusionCharts sales representative: [email protected]. As we discussed in the previous section, you can see we are hyper-focused on improving FusionCharts across developer experience, user experience, new charts, etc.
Now let’s dive in to see what we are planning for each product line per quarter.
Q2 2020 (April to June)
After FusionCharts became part of Idera, we rolled out FusionCharts v3.15.2, FusionTime v2.2, and FusionExport v1.2.3. Here are the highlights:
FusionCharts Suite
- CSS transformation: In this quarter, we added CSS transformations in 2D for charts. We will be covering 3D transformations in the next quarter.
- Product Improvements: Many improvements have been introduced in this quarter, such as more events for Chord and Sankey, addressed customer reported issues in crossline, labels, legends, etc.
FusionTime
- Product Improvements: We improved many components and modules for custom range selector, area plots, binning, data marker, etc.
FusionExport
- Support for FusionTime: We have made it easier for you to export time-series charts in FusionExport by adding support for FusionTime.
Q3 2020 (July to September)
FusionCharts Suite
- CSS transformation: We have already covered 2D transformations in v3.15.2 but in this quarter, we will be adding support for 3D transformations as well.
- API and events improvement: We will be improving events and API especially for data plot-related events. All the data plots related events will have additional information about that data so that you can add real-time interactions.
- Inline HTML support: Many of the chart components like titles and subtitles do not have inline-HTML support. We will be fixing it so that you can add rich text data.
- Pattern fill: When it comes to data plots, you will be able to add custom patterns so that your charts are more accessible.
- Uniform components: This will happen under the hood, you won’t even realize it. In order to make charts components customizable in various devices and layouts, we need to rewrite some of the components. We already did that with legends in v3.15.1, we will continue doing the same.
FusionTime
- Custom tooltip: We know how important it is to show contextual and actionable data in tooltips. In the case of time-series charts, you will be able to modify the appearance tooltips using HTML tags and chart macros.
- Custom date format: We will be offering APIs for you to customize the way show dates on plots.
- Plot gradients: Isn’t it beautiful when you see those beautiful gradients in dark mode on stock charts. Well, we will be adding support for gradients for time-series charts so that you can nail that experience
- Auto time-axis clipping: In the last 6 months we have seen many circuit breakers happen in stock markets. This gave a lot of requests to fix the null data plotted on time-series when there are holidays, weekends, and of course oddballs like circuit breakers.
FusionExport
- Themes: You don’t need to write a custom HTML template for the PDFs you are exporting. We will make it easy for you by providing custom themes.
- Meta-information for PDF: Add metadata for the exported PDFs during runtime.
FusionGrid
As we mentioned earlier, we plan to release the beta version of FusionGrid this quarter. It will include basic features like search, sort, filter, pagination, layout customizations, and inline charts. If you are interested in joining the beta, please contact your FusionCharts sales representative for further steps: [email protected].
Q4 2020 (October to December)
FusionCharts
- Data Store support: This will increase your productivity immensely. We already have the data store support for FusionTime, we will be rolling it out in FusionCharts and FusionGrid as well. It means you don’t have to maintain a separate wrapper to manage your data across components. In fact, as the name suggests, you can use it as a sole data store for your application as well.
- Bundle reduction: We will be removing redundant modules and removing a few polyfill modules for IE which will reduce the overall size significantly. Don’t worry you can always add these modules back as well.
- Range Area and Radial Progress Bar: We will be adding two new charts Range Area so that you can plot range on a line chart. And Radial Progress Bar, so that you can add Apple Watch like circular bars in your dashboards.
- Accessibility for drill-down: We already have an accessibility extension but it does not work with drill-down of charts and maps. We will be adding that feature in this quarter.
FusionTime
- Support for weekly binning: When it comes to grouping the data, you will get support to bin the data based on weeks.
- Auto-generated trendlines: Based on the data provided, we will explore the auto-generation of the trendline. It will make your time-series charts even more informative.
- CSV and Excel support: As the name suggests, we will be adding support for Excel and CSV files to export your time-series charts.
FusionExport
- Support for MS Excel and Word: Many users wish to export data to Word and then make additional changes on top of it before distributing the report. You will be able to do that with Word and Excel support in FusionExport.
FusionGrid
We plan to finish the beta program by this time and make it public. The roadmap and release timeline for FusionGrid will be heavily dependent on your feedback.
Later in 2021
Throughout the year we will be laying the groundwork for 2021. Below are details on what we currently envision for 2021:
FusionCharts
- Integrations: Who does not want integration for their choice of the framework? We will be exploring new integrations like Flutter, Typescript, Blazor, etc. based on the requests and how the developer ecosystem shapes.
- Better performance: One of the consistent themes we have across releases is performance improvements. The constant reduction in the bundle size in the earlier releases will reflect in a better performance.
- Maps improvements: We will be improving our maps API especially when it comes to drill-down of maps.
- Better animation engine: We will be improving the animation API and interactions across the components
- Histogram & Word cloud: We will be exploring two new charts around this time as well: Histogram and Word Cloud.
- Public APIs for Mobile charts: The last two releases will ensure that the groundwork for mobile charts is done. In this quarter we will open APIs for you to write more flexible components.
FusionTime
- Accessibility: We will be adding accessibility support for components like range selector and time navigator so that charts are fully accessible.
- CSS-based styling: We will be opening a few more CSS APIs so that you can customize time-series charts as per your needs.
We hope this gives you a good understanding of the roadmap. If you have any thoughts or questions, feel free to add your comments below or reach out to us at [email protected].
Note: These plans and roadmap represent our intentions as of this date, but our development plans and priorities are subject to change. Accordingly, we can’t offer any commitments or other forms of assurance that we’ll ultimately release any or all of the described products on the schedule or in the order described, or at all. These general indications of development schedules or “product roadmaps” should not be interpreted or construed as any form of a commitment, and our customers’ rights to upgrades, updates, enhancements, and other maintenance releases will be set forth only in the applicable software license agreement.