Data visualization is the graphical presentation of information and data that uses visual elements like graphs, charts, and more to tell engaging stories. Additionally, you’ll need to figure out how to make the data on your website understandable if it uses a lot of data. Humans aren’t very good at understanding lengthy lists of numbers, after all. An Angular chart can help in this situation because it can make even the most complex data correlations understandable and accessible to people who do not speak English. Developers must therefore be familiar with Angular graph creation.
FusionCharts is a platform that stands out in terms of its dependability, simplicity of use, interactivity, and customization, even though several charting tools and libraries are available. With FusionCharts, designing beautiful dashboards for your online and mobile applications is simple. In addition, a standard API, rich documentation, and cross-browser compatibility make it simpler than ever to build interactive and responsive charts. This platform has everything from fundamental charts like line, column, and pie to domain-specific charts like heatmaps, radar, and stock charts. This article will show how to create an Angular Graph in FusionCharts and how you can improve your Angular chart in a data grid. So let’s get started!
Table of Contents
What Are the Benefits of Angular?

Angular has been quite popular recently, and for good reason. First, Angular’s default configuration provides everything you require out of the box. This includes route management features that simplify getting the data you need for your application. In addition, testing is made easier by Angular’s pre-configured environment, which also aids development. Finally, the Angular team has given you the official library, which is all you need. As a result, you may anticipate improved cybersecurity. Read more about the Angular Chart Library for data visualization.
This highly-typed language’s key benefit is that it aids programmers in maintaining clear and understandable code. In addition, with the ability to see frequent mistakes as you type, bugs are simpler to find and remove. This speeds up debugging and simplifies maintaining a huge code base, which are advantages in large enterprise-scale projects. The Angular team created a CLI tool that can be used to generate certain repetitive pieces of code from the command line to improve consistency further. The documentation for the framework also acts as a current resource for developers.
Angular offers excellent code maintainability in several areas. All Angular-related packages are updated simultaneously when upgrading from one major version to another, including HTTP, Routing, and Angular Material. Updating is simple and requires one command, ‘ng update.’ This means you won’t waste time wondering whether the new packages are compatible, pondering which version to use, or figuring out when a certain open-source package will be upgraded to the most recent version. Because Angular is modular, developers can efficiently separate code into modules. This enables simple app feature categorization and the production of reusable code chunks, which may significantly cut down on development time and expense.
How Can I Create A Graph in Angular Using FusionCharts?

With the help of the JavaScript charting library FusionCharts, you can design dynamic charts, gauges, dashboards, and maps. We have created a straightforward and compact Angular component that offers FusionCharts bindings. With the angular-fusioncharts component, adding interactive and rich charts to any Angular project is simple.
Step 1 – What are Some Prerequisites Needed to Create A Chart?
Before starting your projects, you need to have an Angular project set up. Angular requires you to install two components:
Node.js
NPM
Step 2 – How Do I Set Up My Project?
Next, you will have to install the angular-fusioncharts and fusioncharts modules by the following command:
npm install fusioncharts angular-fusioncharts --save
Next, replace the code in the src/app/app.module.ts file with the code shown below to create your first chart. First, import all the dependencies required in @NgModule:
import { BrowserModule } from "@angular/platform-browser";
import { NgModule } from "@angular/core";
import { AppComponent } from "./app.component";
import { FusionChartsModule } from "angular-fusioncharts";
// Import FusionCharts library and chart modules
import * as FusionCharts from "fusioncharts";
import * as charts from "fusioncharts/fusioncharts.charts";
import * as FusionTheme from "fusioncharts/themes/fusioncharts.theme.fusion";
// Pass the fusioncharts library and chart modules
FusionChartsModule.fcRoot(FusionCharts, charts, FusionTheme);
@NgModule({
declarations: [AppComponent],
imports: [BrowserModule, FusionChartsModule],
providers: [],
bootstrap: [AppComponent]
})
export class AppModule {}
Step 3 – How Do I Configure My Chart And Render My Chart?
Before configuring your chart, you need to define your data. FusionCharts accepts the data in JSON format so that the data would take a form like:
const chartData = [
{
label: “Some Label”,
value: "Value"
}
];
Once you’ve defined your data, you can start configuring your chart:
// Chart Configuration
const dataSource = {
chart: {
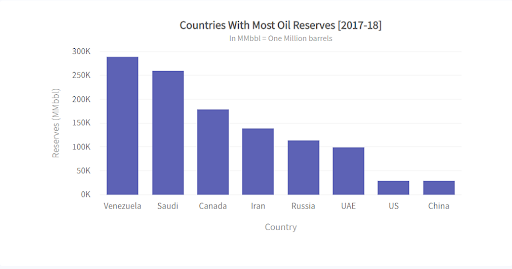
caption: "Countries With Most Oil Reserves [2017-18]", //Set the chart caption
subCaption: "In MMbbl = One Million barrels", //Set the chart subcaption
xAxisName: "Country", //Set the x-axis name
yAxisName: "Reserves (MMbbl)", //Set the y-axis name
numberSuffix: "K",
theme: "fusion" //Set the theme for your chart
},
// Chart Data - from step 2
data: chartData
};
To render your chart, you have to specify the chart data within the AppComponent class in the src/app/app.component.ts file in your root project folder:
import { Component } from "@angular/core";
@Component({
selector: "app-root",
templateUrl: "./app.component.html"
})
export class AppComponent {
dataSource: Object;
constructor() {
//STEP 2 - Chart Data
const chartData = [
{
label: "Venezuela",
value: "290"
},
{
label: "Saudi",
value: "260"
},
{
label: "Canada",
value: "180"
},
{
label: "Iran",
value: "140"
},
{
label: "Russia",
value: "115"
},
{
label: "UAE",
value: "100"
},
{
label: "US",
value: "30"
},
{
label: "China",
value: "30"
}
];
// STEP 3 - Chart Configuration
const dataSource = {
chart: {
//Set the chart caption
caption: "Countries With Most Oil Reserves [2017-18]",
//Set the chart subcaption
subCaption: "In MMbbl = One Million barrels",
//Set the x-axis name
xAxisName: "Country",
//Set the y-axis name
yAxisName: "Reserves (MMbbl)",
numberSuffix: "K",
//Set the theme for your chart
theme: "fusion"
},
// Chart Data - from step 2
data: chartData
};
this.dataSource = dataSource;
}
}
Next, you can use the FusionCharts component to create the chart container in app.component.html and set the width, height, and type attributes as shown.
<h1>
{{title}}
</h1>
<fusioncharts
width="700"
height="400"
type="Column2d"
[dataSource]="dataSource"
>
</fusioncharts>ll
Now, you can view your chart:
Is There an Easier Way to Create Angular Graphs?

FusionCharts makes it very easy to make charts. It is perhaps the most complete JavaScript library for responsive and dynamic charts, making creating stunning graphs simple. Moreover, it only requires a few lines of code to incorporate FusionCharts into your online application. In addition, it offers a variety of graph examples, all of which are regularly updated with bug-free source code. Additionally, it provides comprehensive documentation to help you understand all of the features and individualized support to help you quickly resolve technical issues. Finally, a wide range of graphs is also available in FusionCharts to help you successfully visualize your data.
You can construct responsive, interactive charts with FusionCharts’ Angular Directive that feature zooming, panning, APIs, animation, drill-downs, real-time updates, and even complete chart and dashboard exports. The only dependencies you’ll need are:
- First, install the Node.js, NPM/Yarn globally in your machine
- Then, install AngularCLI globally on your machine
- Finally, install the FusionGrid and Angular components in your project
Once you’ve installed the dependencies, you can start utilizing the AngularCLI, create your application, and import “FusionGridModule” from “angular-fusiongrid” and “FusionGrid.” Shown below is an example:
import { Component } from "@angular/core";
const data = chartData; // From the Previous Example
chart: {
caption: "Countries With Most Oil Reserves [2017-18]",
subcaption: "In MMbbl = One Million barrels",
xaxisname: "Country",
yaxisname: "Reserves (MMbbl)",
numbersuffix: "K",
theme: "fusion"
},
data:
@Component({
selector: "app-root",
template: "./app.component.html" /* see HTML tab */
})
export class AppComponent {
width = 600;
height = 400;
type = "column2d";
dataFormat = "json";
dataSource = data;
}
You should now be able to see your chart:
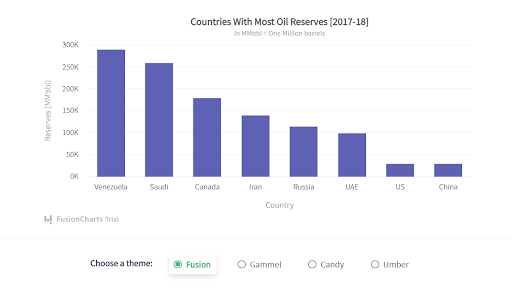
As you can see, FusionCharts improves the process of building charts in Angular. We haven’t mentioned all the features that FusionCharts has to offer.
Why Use Angular in FusionCharts?

FusionCharts is perhaps one of the best open-source frameworks for making charts for web applications. Since developers created it for developers, it is arguably the best framework for creating charts. This platform provides different graph examples, all of which have source code, are updated frequently and are error-free. Additionally, it offers one-on-one assistance to quickly resolve technical problems and information on various charts and dashboards to assist you in comprehending all the options.
Click here and start using FusionCharts to visualize your angular graph In a data grid easily!
