Companies and businesses collect loads of data every day. However, it’s challenging to draw actionable insights from raw data. As a result, businesses worldwide use reports and dashboards to track key performance indicators (KPIs), identify and understand trends, and draw valuable insights. Reports and business dashboards are, in fact, essential tools for all types of businesses, small or large, as they help analyze and visualize valuable business data and meet business intelligence needs. They help companies inspect business performance, understand customer needs, and make critical data-driven decisions. While dashboards and reports are extensively used in companies, many people don’t know the difference between reports vs. dashboards.
If you want to know how reports and dashboards differ, this article is the right place.
Table of Contents
What Is The Role Of A Report Vs. Dashboard In Business Intelligence?
Business intelligence (BI) refers to a set of technologies and processes that enable businesses to transform their raw data into actionable insights. Business intelligence dashboards and reports are an essential part of the BI process. These two are essentially data analysis tools consisting of data visualizations. They help businesses analyze data efficiently, make critical strategic decisions, improve revenue, and gain competitive advantages.
Modern business intelligence solutions allow users to create both dashboards and reports. However, these two tools have different use cases. Read on to learn when to use reports vs. dashboards.
What Is A Report?

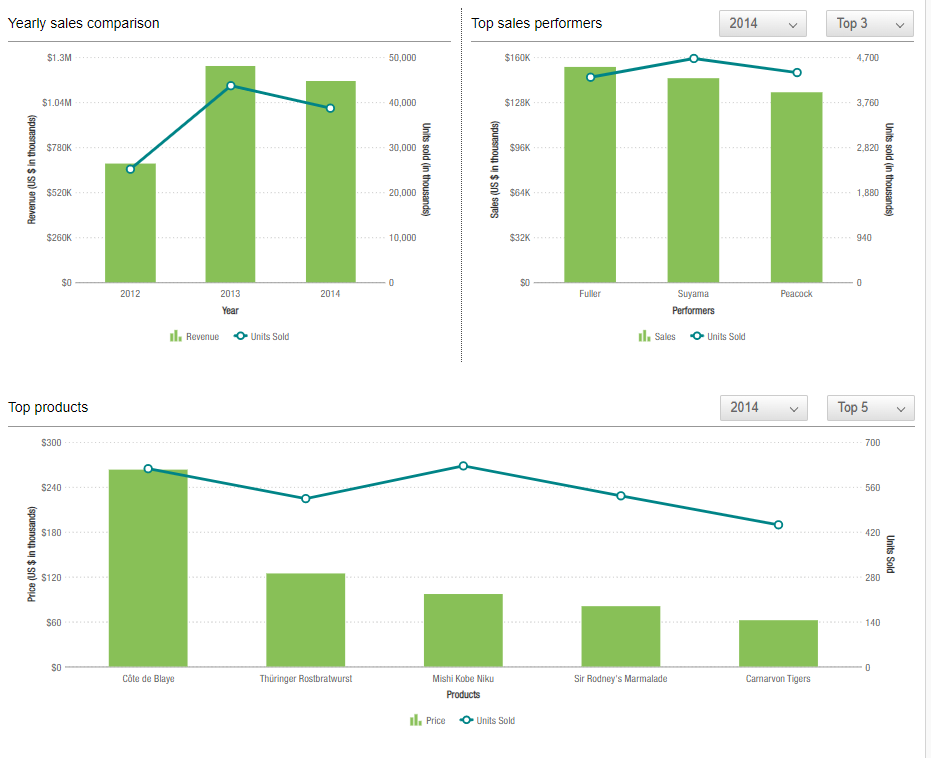
A report is an official business document that consists of details about how the business is doing within a specific area at a particular time. Typically, a business report contains statistical data, factual information, and research findings in the form of graphs, charts, text, and tables.
Reports contain more detailed information compared to dashboards. For example, a sales dashboard may only provide information regarding the sales of the entire company. On the other hand, a report will give information about the performance of each sales region, as well as the performance of employees in the sales department. Hence, CEOs and CFOs can use reports to make critical leadership decisions. As a result, reports are longer than dashboards, both visually and in terms of the amount of detail. When reports are viewed in digital format, readers typically have to scroll through multiple pages.
However, reports are static and cannot be updated in real-time. Additionally, users can not interact with them similarly to BI dashboards.
What Is A Dashboard?
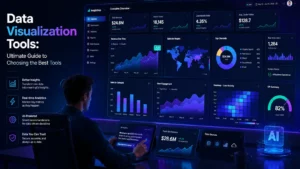
A dashboard consists of real-time visualizations representing critical business data on a single screen, such as financial metrics and key performance indicators (KPIs). As a result, a dashboard is designed to answer a central question, such as how the business is performing. In other words, you can use a dashboard to monitor and track business performance and activities at the moment of analysis.
A BI dashboard is designed to represent and display the most important data in a particular area in a single view. For example, a financial dashboard can include financial KPIs and the most important metrics like gross profit margin, net profit margin, and price-to-earning ratio. Since dashboards consist of real-time data visualizations, they present the most up-to-date data.
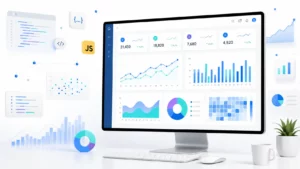
A BI dashboard consists of multiple data visualizations, such as graphs, charts, and maps. Depending on the BI solution you’re using, you can also create interactive dashboards. For example, you can add drill downs to charts, create drag-able charts, create scroll charts, and more.
Reports Vs. Dashboards – Why Are Reports And Dashboards Useful?
Both reports and dashboards are essential for gaining valuable insights from raw data. They help analyze and communicate data.
Here are the key features of a business report:
- Provides detailed information regarding a specific business area and helps with detailed analysis of specific data
- Highlights key metrics
- Outlines business plans and helps make future plans
- Helps businesses understand where to invest and spend resources
Here are the key features of dashboards:
- Help businesses examine the information at a glance
- Offer a valuable summary of business metrics and trends. Companies can then use this information to identify areas of improvement and interesting patterns
- Real-time dashboards are refreshed with live data constantly
- Dashboards are interactive. For example, dashboards allow users to view in-depth information with drill-downs
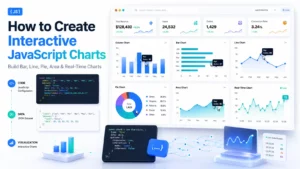
If you’re looking for an efficient tool to create highly interactive and real-time dashboards, FusionCharts is the best choice. FusionCharts comes with several pre-built dashboards and supports several user interactions, such as zoom in and out, scroll charts, drill downs, drag-able, interactive legend, and more. It also offers several customization options. For example, you can add titles, labels, axis labels, and trendlines.
Reports Vs. Dashboards – What Are The Key Differences Between Reports and Dashboards?
The table below shows the key differences between reports vs. dashboards:
| Reports | Dashboards | |
| Scope | Reports focus on one specific area and provide detailed data and information about that area | Dashboards provide a wide breadth of information/broad overview of data via several metrics to help examine the information at a glance |
| Interpretation | The person who prepares a report provides their own point of view on the data | Dashboards are essentially an objective collection of information |
| Purpose | To show how the business is performing, summarize the results of a project, pitch and analyze an idea, make future plans, update your team on a specific project, and help make critical leadership decisions | To answer a central question and see how the company is performing in real-time |
| Format | Reports are static, so they aren’t updated in real-time. You can print them or save them in digital format. | Dashboards are interactive and show real-time data. They are viewed on an electronic device and require a software interface like a website |
| View | Usually consists of multiple pages | Single-page or single-screen view |
What Are The Similarities Between Reports And Dashboards?
There are only a few similarities between reports and dashboards. Firstly, both dashboards and reports are used for presenting data or information. Additionally, they both consist of data visualizations like charts and graphs. While both reports and dashboards can include tables, dashboards usually don’t have tables.
Reports Vs. Dashboards: Which Is The Better Option To Use?
This depends on the business use case. Dashboards are perfect for an overview of where the business stands in real-time. Dashboards offer interactivity, and the data is updated in real-time. In contrast, reports are great for more detailed information about a specific topic or area and gain deeper insight. However, reports are static. Both reports and dashboards ultimately present data and help make critical decisions.
Conclusion
Reports are dashboards are an essential part of the business intelligence process. They both have different use cases. Knowing the similarities and differences between reports vs. dashboards can help you decide when to use which tool.
Download FusionCharts and try its impressive features today!