Data is a big part of modern software. Companies use charts to track sales, monitor systems, measure growth, and understand customer behavior. Without charts, it can be hard to spot patterns or trends.
Most developers do not build charts from scratch. It takes time and effort to create interactive charts that work well across devices. A good JavaScript charting library solves that problem. It provides ready-made charts, built-in features, and support for popular frameworks. If you’re new to charting tools, learn what a JavaScript charting library is before exploring the options below.
The difficult part is choosing the right library. Some tools are great for simple projects. Others are designed for large dashboards and complex data.
This guide compares the 10 best JavaScript charting libraries available today. We’ll look at their features, performance, framework support, and pricing. By the end, you’ll have a clear idea of which library is the best fit for your next project.
Table of Contents
Key Takeaways
- The best JavaScript charting library depends on your project size, data complexity, and performance requirements.
- Chart.js is a popular choice for simple dashboards and small web applications.
- D3.js offers the most flexibility for custom data visualizations.
- Apache ECharts and Plotly.js are strong options for handling large datasets and advanced analytics.
- Recharts is designed specifically for React applications.
- FusionCharts provides 100+ chart types, 2,000+ maps, and enterprise-grade features in a single platform.
- For business intelligence tools, financial dashboards, and large-scale SaaS applications, FusionCharts and Highcharts are among the strongest enterprise solutions.
The Core Selection Criteria: How to Evaluate a JS Charting Library
Not all charting libraries are built for the same purpose. Some are designed for simple charts and quick projects, while others are built for enterprise dashboards, real-time data, and advanced analytics. Before comparing the top options, it’s helpful to understand the key factors that separate a good library from a great one.
Rendering Engine
A charting library’s rendering engine affects its performance, flexibility, and scalability. Most libraries use one of three technologies:
- SVG (Scalable Vector Graphics): Great for interactive charts, animations, and responsive layouts.
- Canvas: Handles large datasets and frequent updates more efficiently than SVG.
- WebGL: Uses GPU acceleration to render massive datasets and complex visualizations.
Each approach has strengths and trade-offs. If you’re deciding between SVG and Canvas, check out our detailed guide on Canvas vs. SVG charts.
Feature Depth
The best JavaScript chart libraries offer more than basic bar and line charts. Look for built-in features such as:
- Interactive tooltips
- Zooming and panning
- Exporting and printing
- Real-time updates
- Drill-down capabilities
- Advanced chart types like heatmaps, Gantt charts, gauges, and financial charts
A rich feature set can reduce development time and eliminate the need for additional plugins.
Framework Compatibility
Most modern web applications use frameworks such as React, Vue, or Angular. Choosing a library with official framework wrappers makes integration easier and helps avoid direct DOM manipulation.
If you plan to use server-side rendering with frameworks like Next.js, it’s also worth checking whether the library supports SSR environments.
Licensing and Support
Licensing can have a major impact on long-term costs. Open-source libraries are often free to use and have active communities. However, support usually comes from documentation, forums, and community discussions.
Commercial libraries typically include dedicated technical support, regular updates, security fixes, and service-level commitments. For many businesses, this level of support is important when building customer-facing applications or enterprise dashboards.
Top 10 JavaScript Charting Libraries Compared
The best JavaScript charting library depends on your project requirements. Some libraries focus on simplicity and ease of use, while others are designed for large datasets, complex dashboards, and enterprise applications.
To help you make the right choice, we’ve reviewed the 10 most popular charting libraries available today. Each review covers the library’s strengths, limitations, pricing model, and ideal use cases, making it easier to compare your options side by side.
1. FusionCharts
Overview
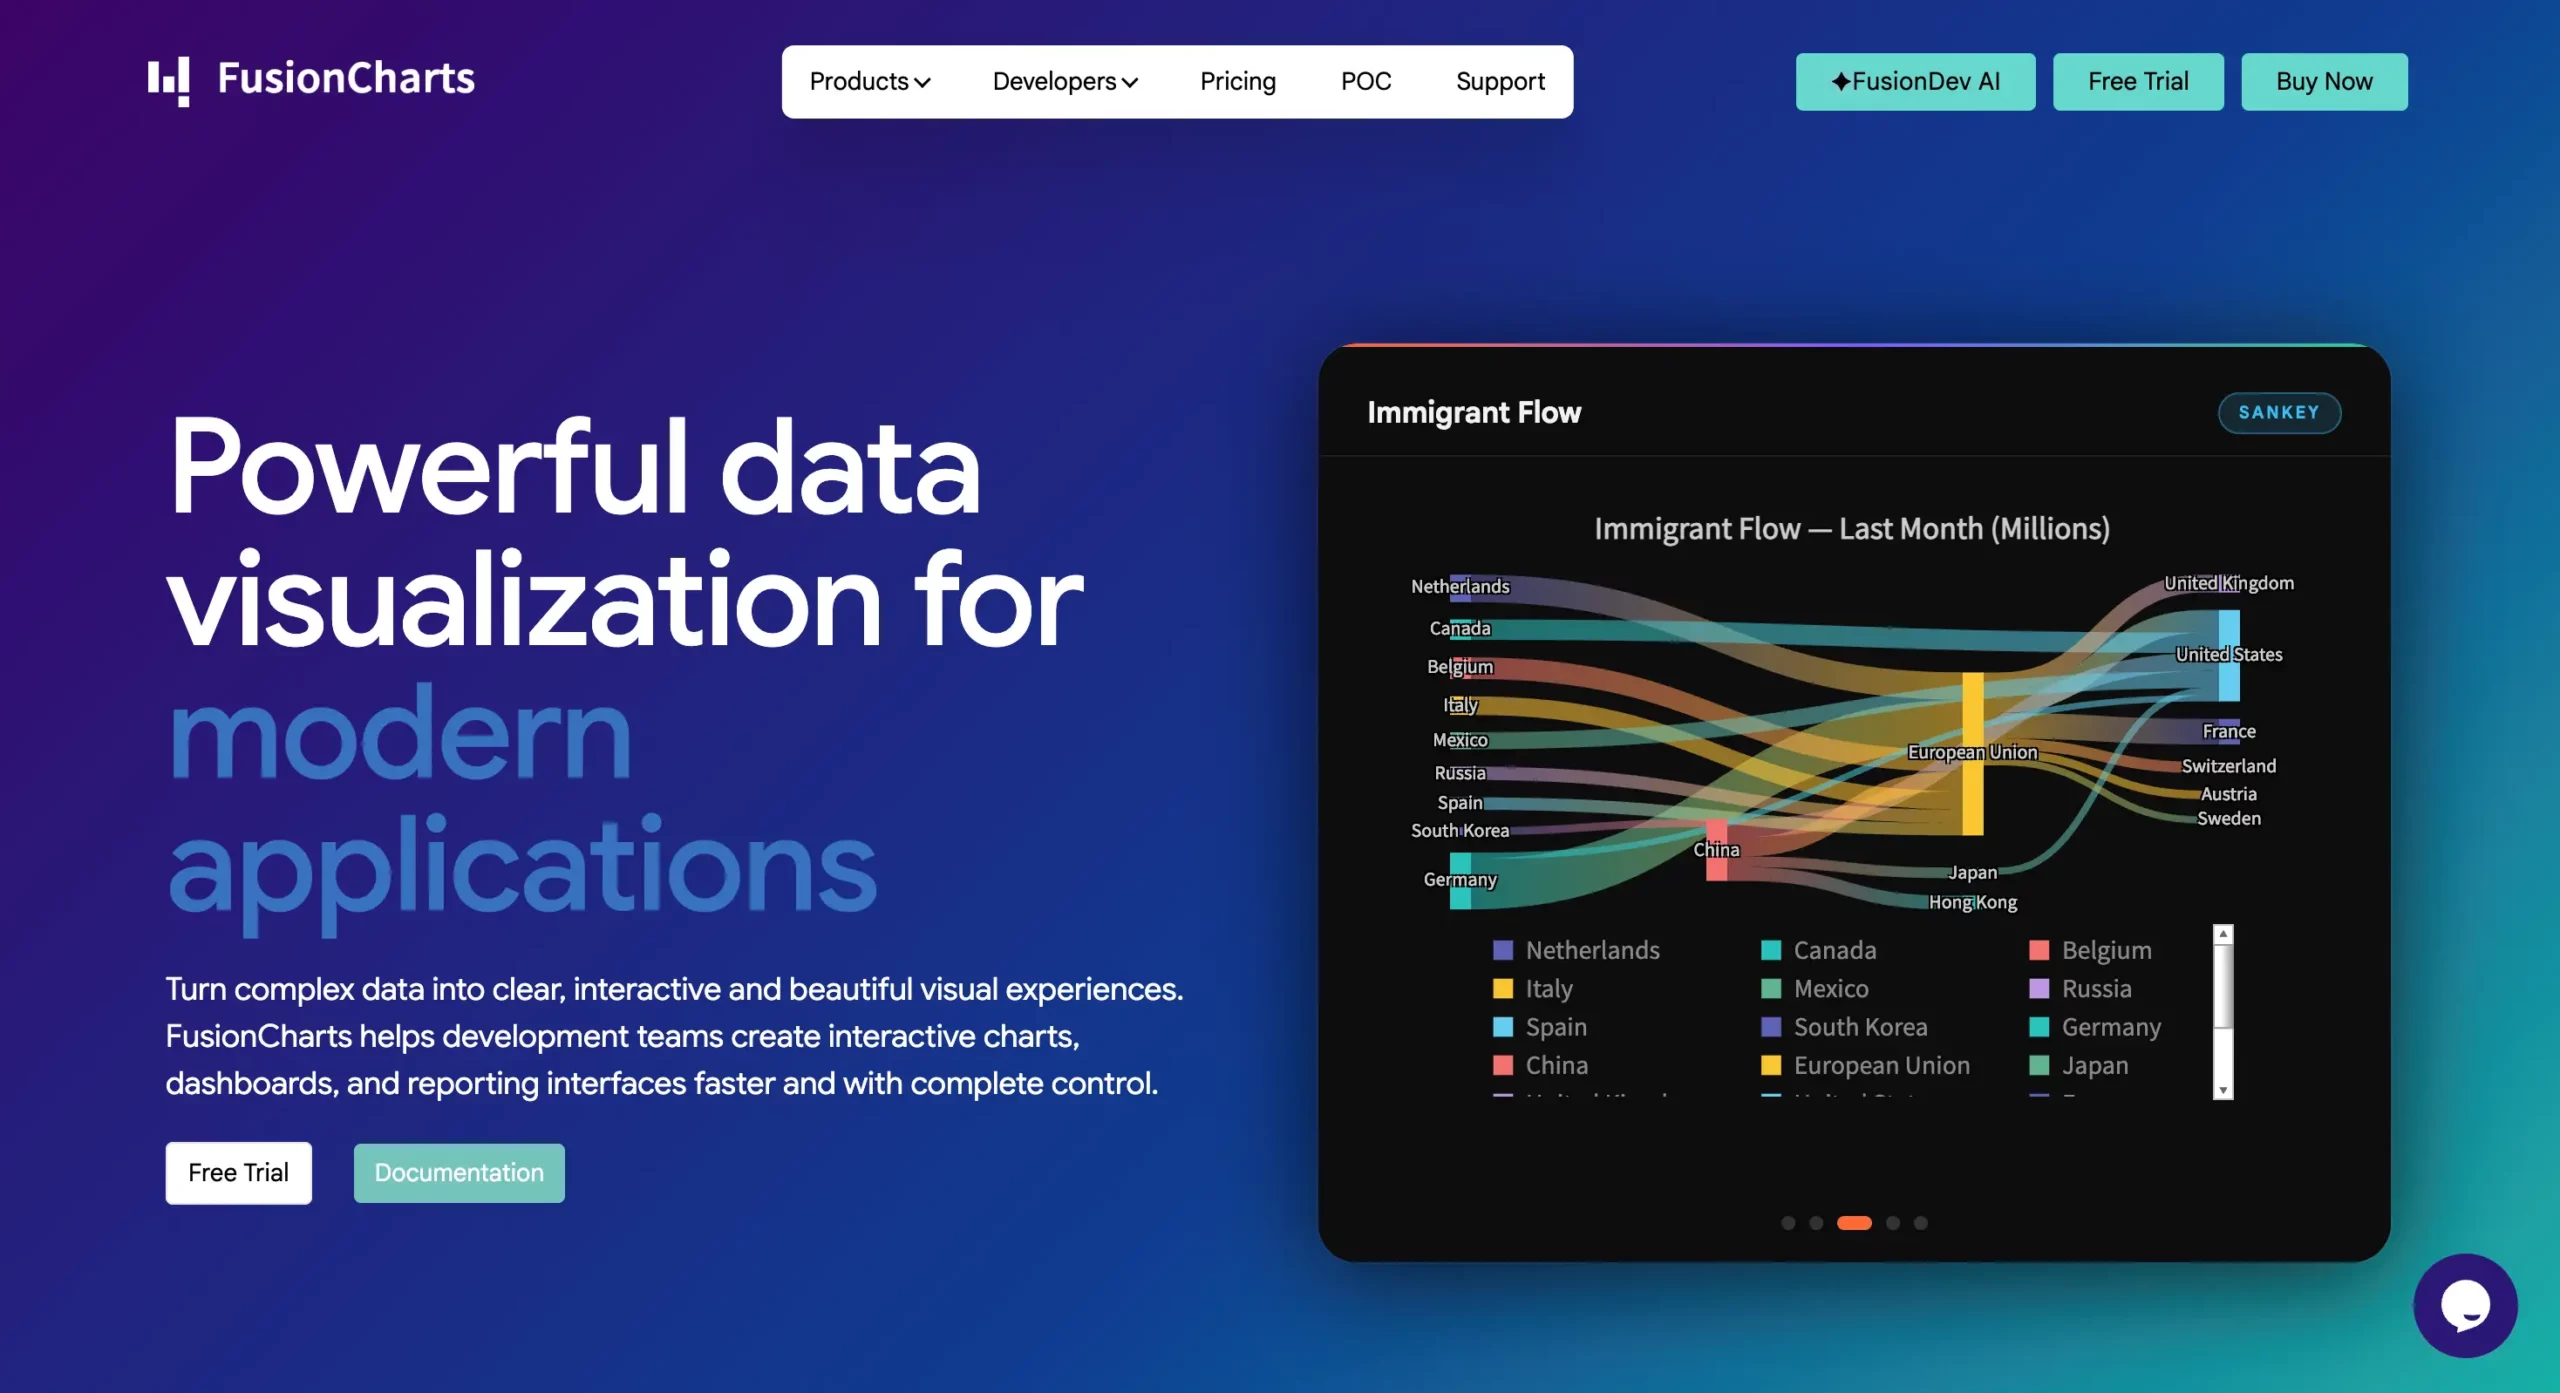
FusionCharts is a powerful JavaScript charting library built for enterprise applications, business intelligence platforms, and data-heavy dashboards. It offers more than 100 interactive chart types and over 2,000 maps, making it one of the most complete data visualization solutions on the market.
Unlike many charting tools that focus only on basic visualizations, FusionCharts includes advanced options such as Gantt charts, heatmaps, funnel charts, gauges, financial charts, and real-time dashboards. It also provides official integrations for React, Vue, and Angular, helping teams add charts to modern web applications with minimal setup.
Best Used For
- Enterprise SaaS platforms
- Financial and operational dashboards
- Executive reporting tools
- Business intelligence applications
- Data-intensive web applications
Pros
- 100+ interactive chart types and 2,000+ maps
- Official React, Vue, and Angular integrations
- Built-in exporting and printing capabilities
- Supports advanced charts, gauges, and maps in one package
- Handles large and complex datasets efficiently
- Extensive documentation and commercial support
- Strong cross-browser compatibility
Cons
- Commercial license required for production use
- More features than smaller projects may need
- Higher learning curve than lightweight libraries like Chart.js
Pricing & Licensing
FusionCharts is a commercial charting library with flexible licensing options for developers, teams, and enterprises. A free trial is available for evaluation before purchase.
2. Chart.js
Overview
Chart.js is one of the most popular open-source JavaScript charting libraries available today. Known for its simplicity and ease of use, it helps developers create attractive charts with minimal code. The library uses Canvas rendering, which provides good performance and smooth animations for small to medium-sized datasets.
Chart.js supports common chart types such as bar, line, pie, doughnut, radar, and scatter charts. Its large community, extensive documentation, and active ecosystem make it a popular choice for startups, personal projects, and lightweight business applications.
Best Used For
- Small to medium-sized web applications
- Startup dashboards
- Internal business tools
- Educational projects
- Developers new to data visualization
Pros
- Free and open-source
- Easy to learn and implement
- Clean and modern chart designs
- Canvas-based rendering for solid performance
- Large community and plugin ecosystem
- Extensive documentation and tutorials
Cons
- Limited selection of advanced chart types
- Requires plugins for some advanced features
- Less suitable for highly complex enterprise dashboards
- Can become difficult to manage in large-scale reporting applications
Pricing & Licensing
Chart.js is free and open-source under the MIT License, making it a popular choice for developers and organizations looking for a cost-effective charting solution.
3. D3.js
Overview
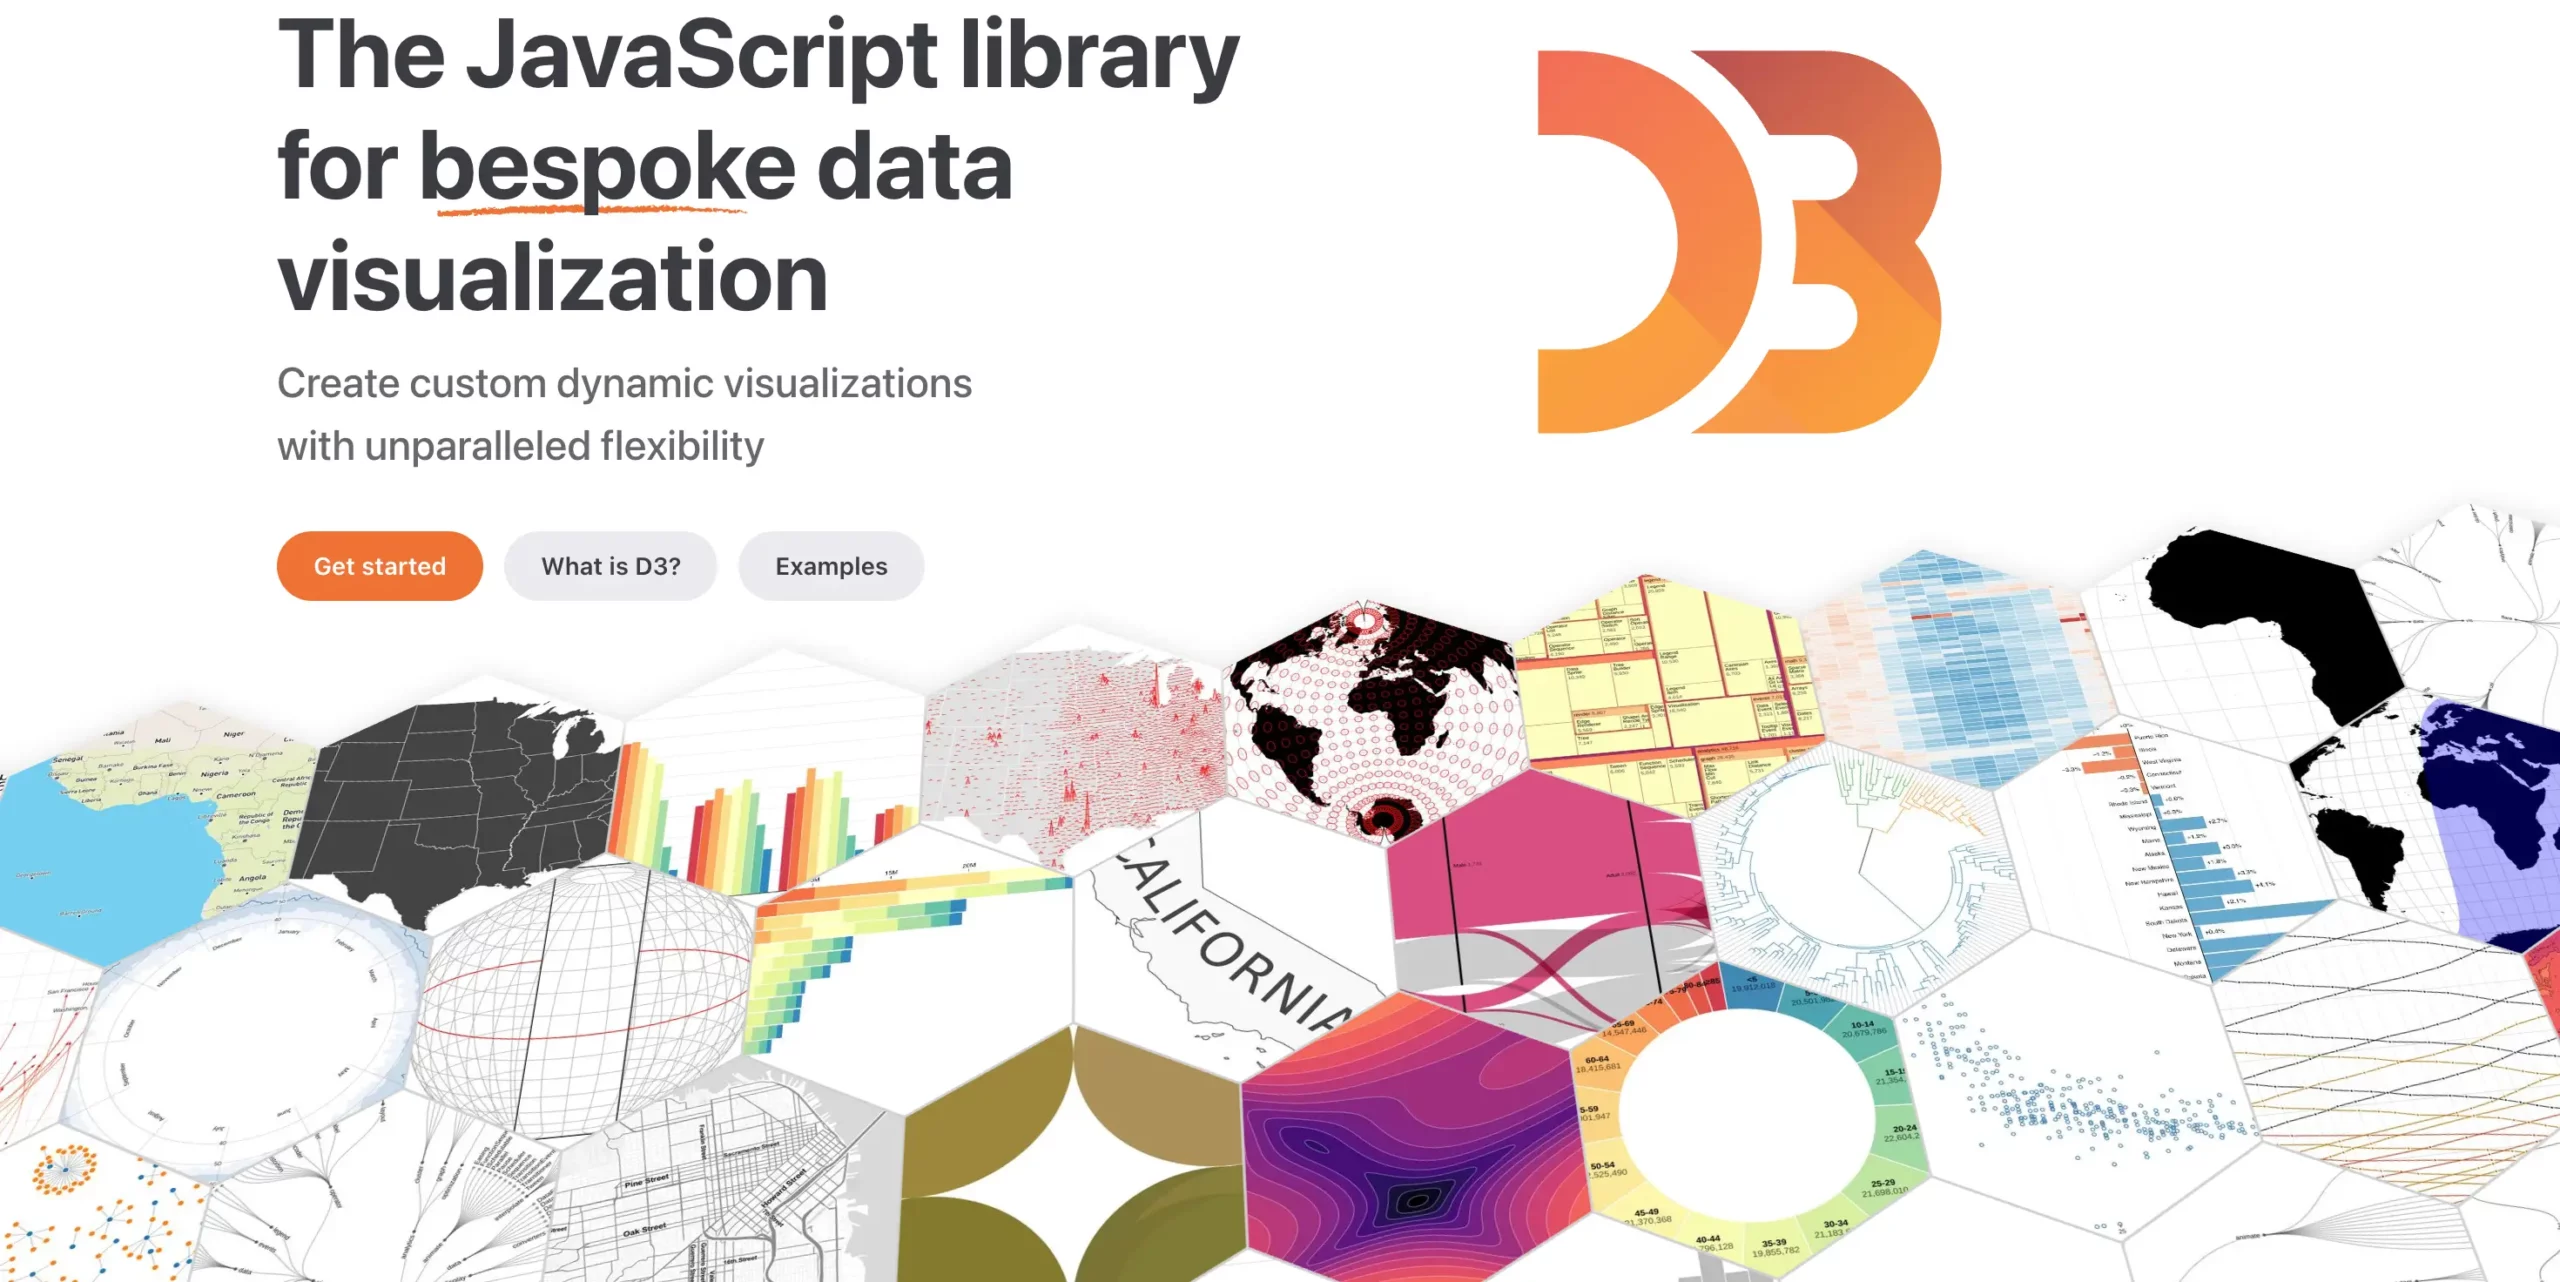
D3.js is one of the most powerful data visualization libraries available for JavaScript. Unlike traditional charting libraries, D3 gives developers direct control over web page elements, making it possible to create highly customized charts and visual experiences. Many modern visualization tools and charting libraries are built on concepts introduced by D3.
The trade-off is complexity. D3 is not a plug-and-play solution. Instead of selecting a chart type and supplying data, developers often need to build visualizations from the ground up. This flexibility makes D3 a favorite among experienced developers, data journalists, and visualization specialists.
Best Used For
- Custom data visualizations
- Interactive storytelling and infographics
- Research and scientific projects
- Data journalism
- Applications that require complete design freedom
Pros
- Extremely flexible and customizable
- Full control over SVG, Canvas, and DOM elements
- Supports virtually any type of visualization
- Large community and learning resources
- Excellent for unique, non-standard charts
Cons
- Steep learning curve for beginners
- Requires more development time than traditional chart libraries
- Not a ready-made charting solution out of the box
- Maintenance can become challenging for large projects
Pricing & Licensing
D3.js is free and open-source under the ISC License, making it available for both personal and commercial use.
4. Highcharts
Overview
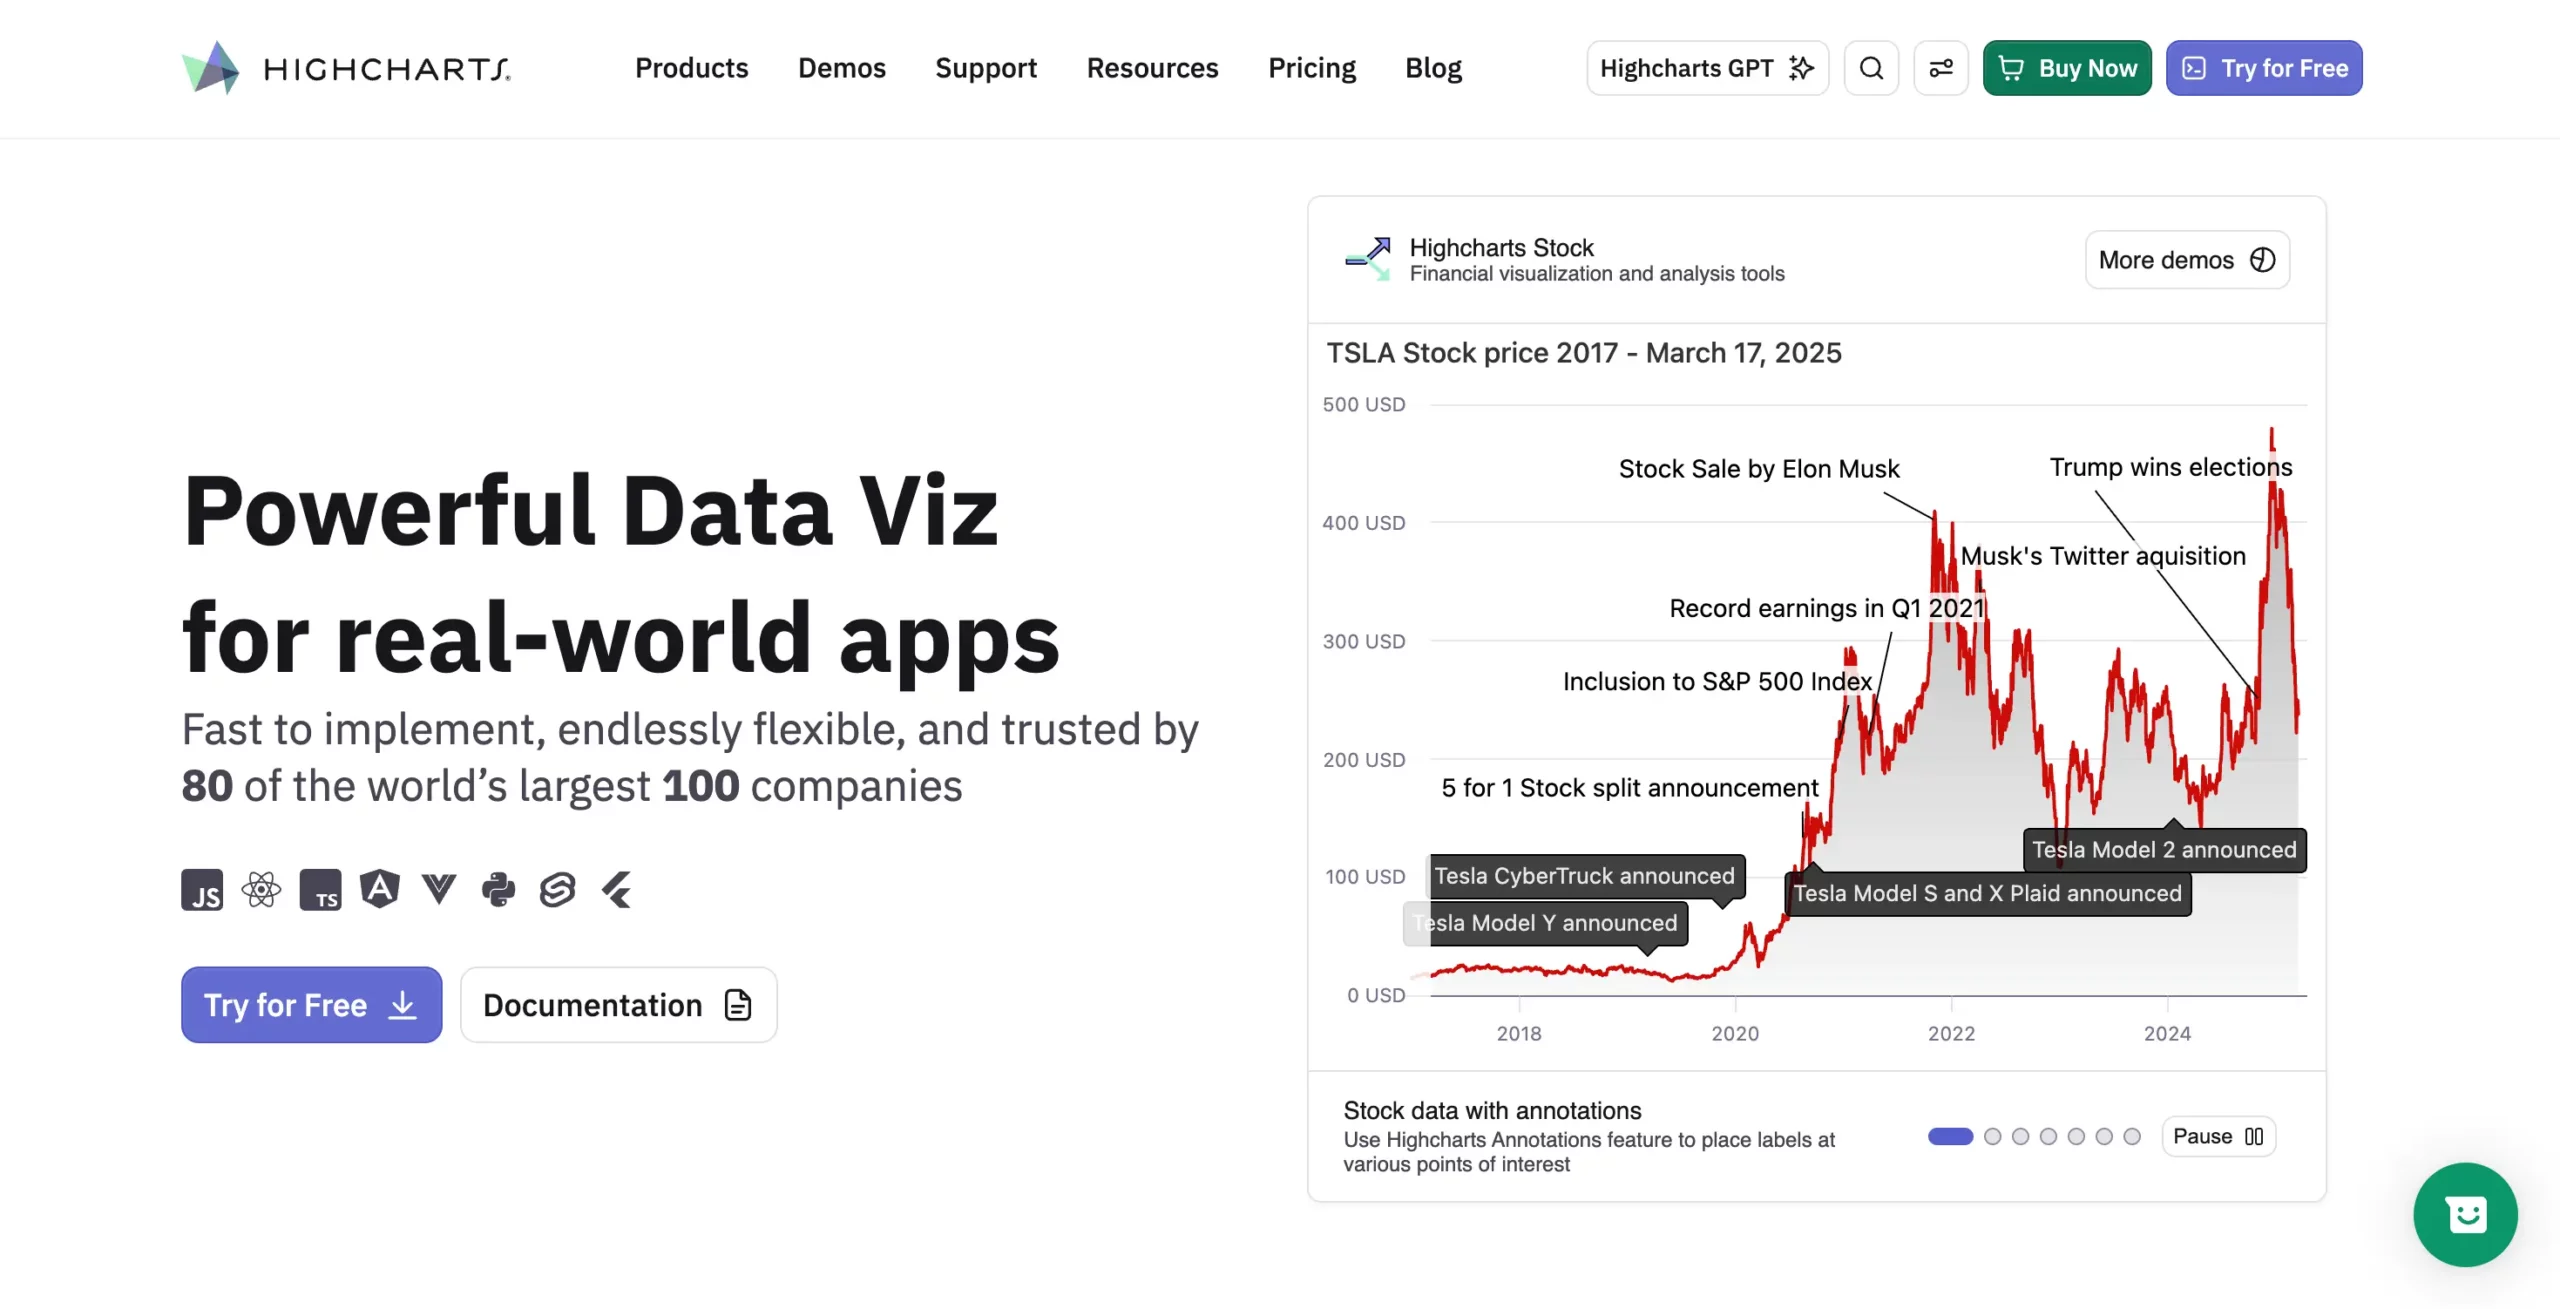
Highcharts is a well-established JavaScript charting library that has been widely used by businesses and developers for more than a decade. It offers a large collection of chart types, strong customization options, and a mature ecosystem that supports a wide range of use cases.
The library is known for its polished visualizations and reliable performance. In addition to standard charts, Highcharts provides specialized modules for stock market data, maps, and Gantt charts. Its long history and strong documentation make it a popular choice for organizations looking for a proven commercial solution.
Best Used For
- Business dashboards
- Financial and stock market applications
- Reporting platforms
- Enterprise web applications
- Data-rich websites
Pros
- Large selection of chart types
- Strong customization capabilities
- Mature and stable platform
- Modules available for stock charts, maps, and Gantt charts
- Extensive documentation and community support
- Good accessibility features
Cons
- Commercial license required for most business use cases
- Licensing costs can increase as projects scale
- Some advanced features require additional modules
- Can require more configuration than simpler libraries
Pricing & Licensing
Highcharts is free for personal and non-commercial use. Commercial projects require a paid license, with pricing based on the number of developers and deployment requirements.
5. Apache ECharts
Overview
Apache ECharts is a popular open-source JavaScript charting library known for its strong performance and rich feature set. Originally developed by Baidu and later donated to the Apache Software Foundation, it has grown into one of the most widely used charting solutions for large-scale web applications.
The library supports a wide range of chart types, including heatmaps, treemaps, geographic maps, scatter plots, and real-time visualizations. Its Canvas-based rendering engine allows it to handle large datasets efficiently, making it a strong choice for analytics dashboards and data-intensive applications.
Best Used For
- Analytics and reporting dashboards
- Data-heavy web applications
- Real-time monitoring systems
- Geographic and mapping visualizations
- Enterprise and large-scale projects
Pros
- Free and open-source
- Excellent performance with large datasets
- Wide selection of chart types and visualization options
- Strong support for interactive features and animations
- Built-in maps and geographic visualizations
- Active community and regular updates
Cons
- Documentation can be harder to navigate than some competitors
- Learning curve is steeper than Chart.js
- Fewer official integrations compared to some commercial platforms
- Enterprise support options are limited compared to commercial vendors
Pricing & Licensing
Apache ECharts is free and open-source under the Apache License 2.0, making it suitable for both personal and commercial projects without licensing fees.
6. ApexCharts
Overview
ApexCharts is a modern JavaScript charting library that focuses on simplicity, attractive visuals, and developer-friendly integrations. It offers a clean API and a wide range of interactive chart types, making it a popular choice for startups, SaaS products, and internal business dashboards.
The library includes built-in features such as zooming, animations, tooltips, and responsive layouts. It also provides dedicated integrations for popular frameworks like React, Vue, and Angular, helping developers get charts up and running quickly.
Best Used For
- Startup and SaaS dashboards
- Internal business tools
- Admin panels
- Analytics applications
- Projects that need attractive charts with minimal setup
Pros
- Clean and modern chart designs
- Easy to learn and implement
- Responsive by default
- Built-in interactive features such as zooming and tooltips
- Official integrations for React, Vue, and Angular
- Good documentation and examples
Cons
- Smaller chart selection than enterprise-focused platforms
- Limited advanced visualizations compared to FusionCharts or Highcharts
- May require additional customization for highly complex reporting needs
- Commercial licensing applies to some use cases and products
Pricing & Licensing
ApexCharts offers free and commercial licensing options depending on the product and usage requirements. Developers should review the latest licensing terms before using it in commercial applications.
7. Recharts
Overview
Recharts is a charting library built specifically for React applications. Unlike many general-purpose charting libraries, Recharts uses React components and SVG elements to create charts, making it feel like a natural extension of the React ecosystem.
The library focuses on simplicity and developer experience. Developers can build charts using reusable React components while benefiting from React’s state management and rendering model. This makes Recharts a popular choice for modern React dashboards and data-driven web applications.
Best Used For
- React applications
- SaaS dashboards
- Admin panels
- Internal business tools
- Projects that prioritize React integration
Pros
- Built specifically for React
- Easy to use with React components
- Clean and readable API
- Responsive chart support
- Good customization options for common chart types
- Active community and documentation
Cons
- Limited to the React ecosystem
- Smaller chart selection than enterprise-focused libraries
- SVG rendering can impact performance with very large datasets
- Not ideal for highly complex reporting and analytics platforms
Pricing & Licensing
Recharts is free and open-source under the MIT License, making it suitable for both personal and commercial projects.
Want to see a React charting library in action? Follow our tutorial on how to create interactive React charts using FusionCharts.
8. Plotly.js
Overview
Plotly.js is a powerful open-source JavaScript charting library designed for scientific, statistical, and analytical applications. Built on top of D3.js and stack-agnostic by design, it allows developers to create highly interactive charts without being tied to a specific frontend framework.
The library supports a wide range of visualization types, including scatter plots, heatmaps, 3D charts, contour plots, financial charts, and geographic maps. Its advanced analytical capabilities have made it a popular choice among data scientists, researchers, engineers, and organizations that work with complex datasets.
Best Used For
- Scientific and research applications
- Statistical analysis tools
- Engineering dashboards
- Financial and quantitative analytics
- Data science projects
Pros
- Supports advanced and specialized chart types
- Strong interactive features, including zooming and filtering
- Excellent for scientific and statistical visualizations
- Works with multiple frameworks and technology stacks
- Supports 3D charts and complex data exploration
- Active community and open-source ecosystem
Cons
- Larger bundle size than many competitors
- Can be more complex to learn than Chart.js or ApexCharts
- Some advanced enterprise features require Plotly commercial products
- May be excessive for simple dashboard projects
Pricing & Licensing
Plotly.js is free and open-source under the MIT License. Plotly also offers commercial products and enterprise solutions for teams that need advanced collaboration, deployment, and support features.
9. amCharts
Overview
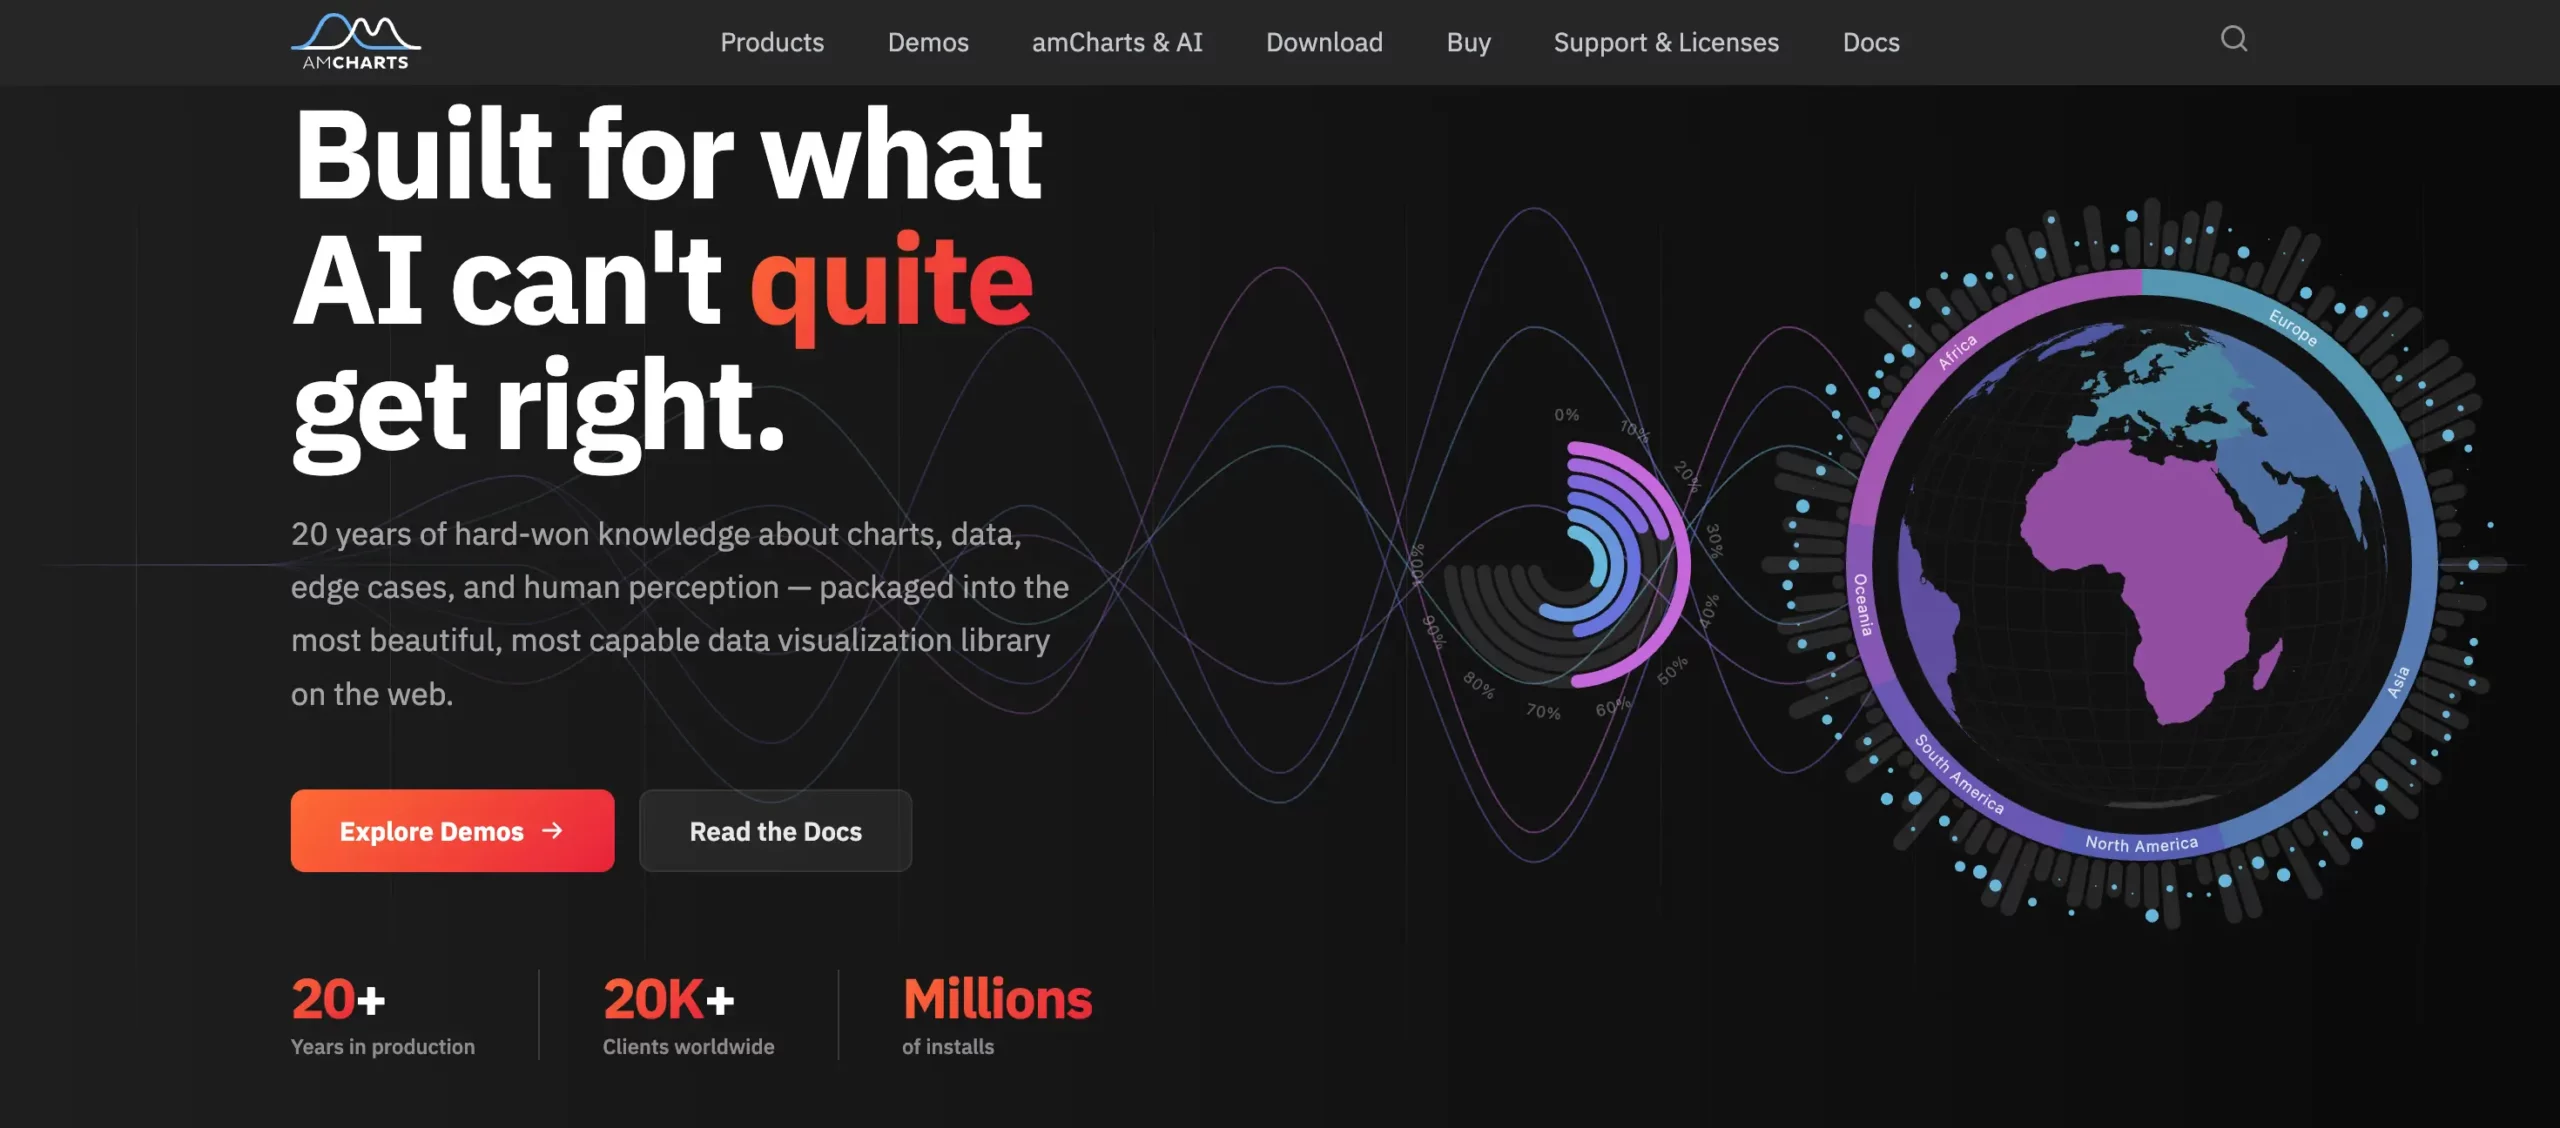
amCharts is a feature-rich JavaScript charting library known for its polished visualizations, smooth animations, and interactive user experience. The library offers a wide range of charts, maps, timelines, and infographics, making it a strong choice for applications where visual appeal is a top priority.
In addition to standard chart types, amCharts includes advanced visualizations such as geographic maps, Gantt-style timelines, and hierarchical charts. Its extensive customization options allow developers to create highly branded and visually engaging dashboards.
Best Used For
- Interactive business dashboards
- Data storytelling applications
- Marketing and reporting tools
- Geographic and mapping projects
- Applications that prioritize visual presentation
Pros
- Attractive, modern chart designs
- Smooth animations and transitions
- Wide range of chart types and maps
- Extensive customization options
- Strong documentation and examples
- Built-in accessibility features
Cons
- Free tier requires keeping the amCharts logo on all charts and removing the branding logo requires a commercial license.
- Canvas-based rendering makes DOM-based CSS styling more difficult.
- Advanced customizations require understanding its unique engine structure.
Pricing & Licensing
amCharts 5 is free to use for both commercial and non-commercial projects under the branded license. To remove the logo, companies must purchase a commercial license. Pricing scales based on the number of developers and whether the software is a SaaS product or a single website.
10. Google Charts
Overview
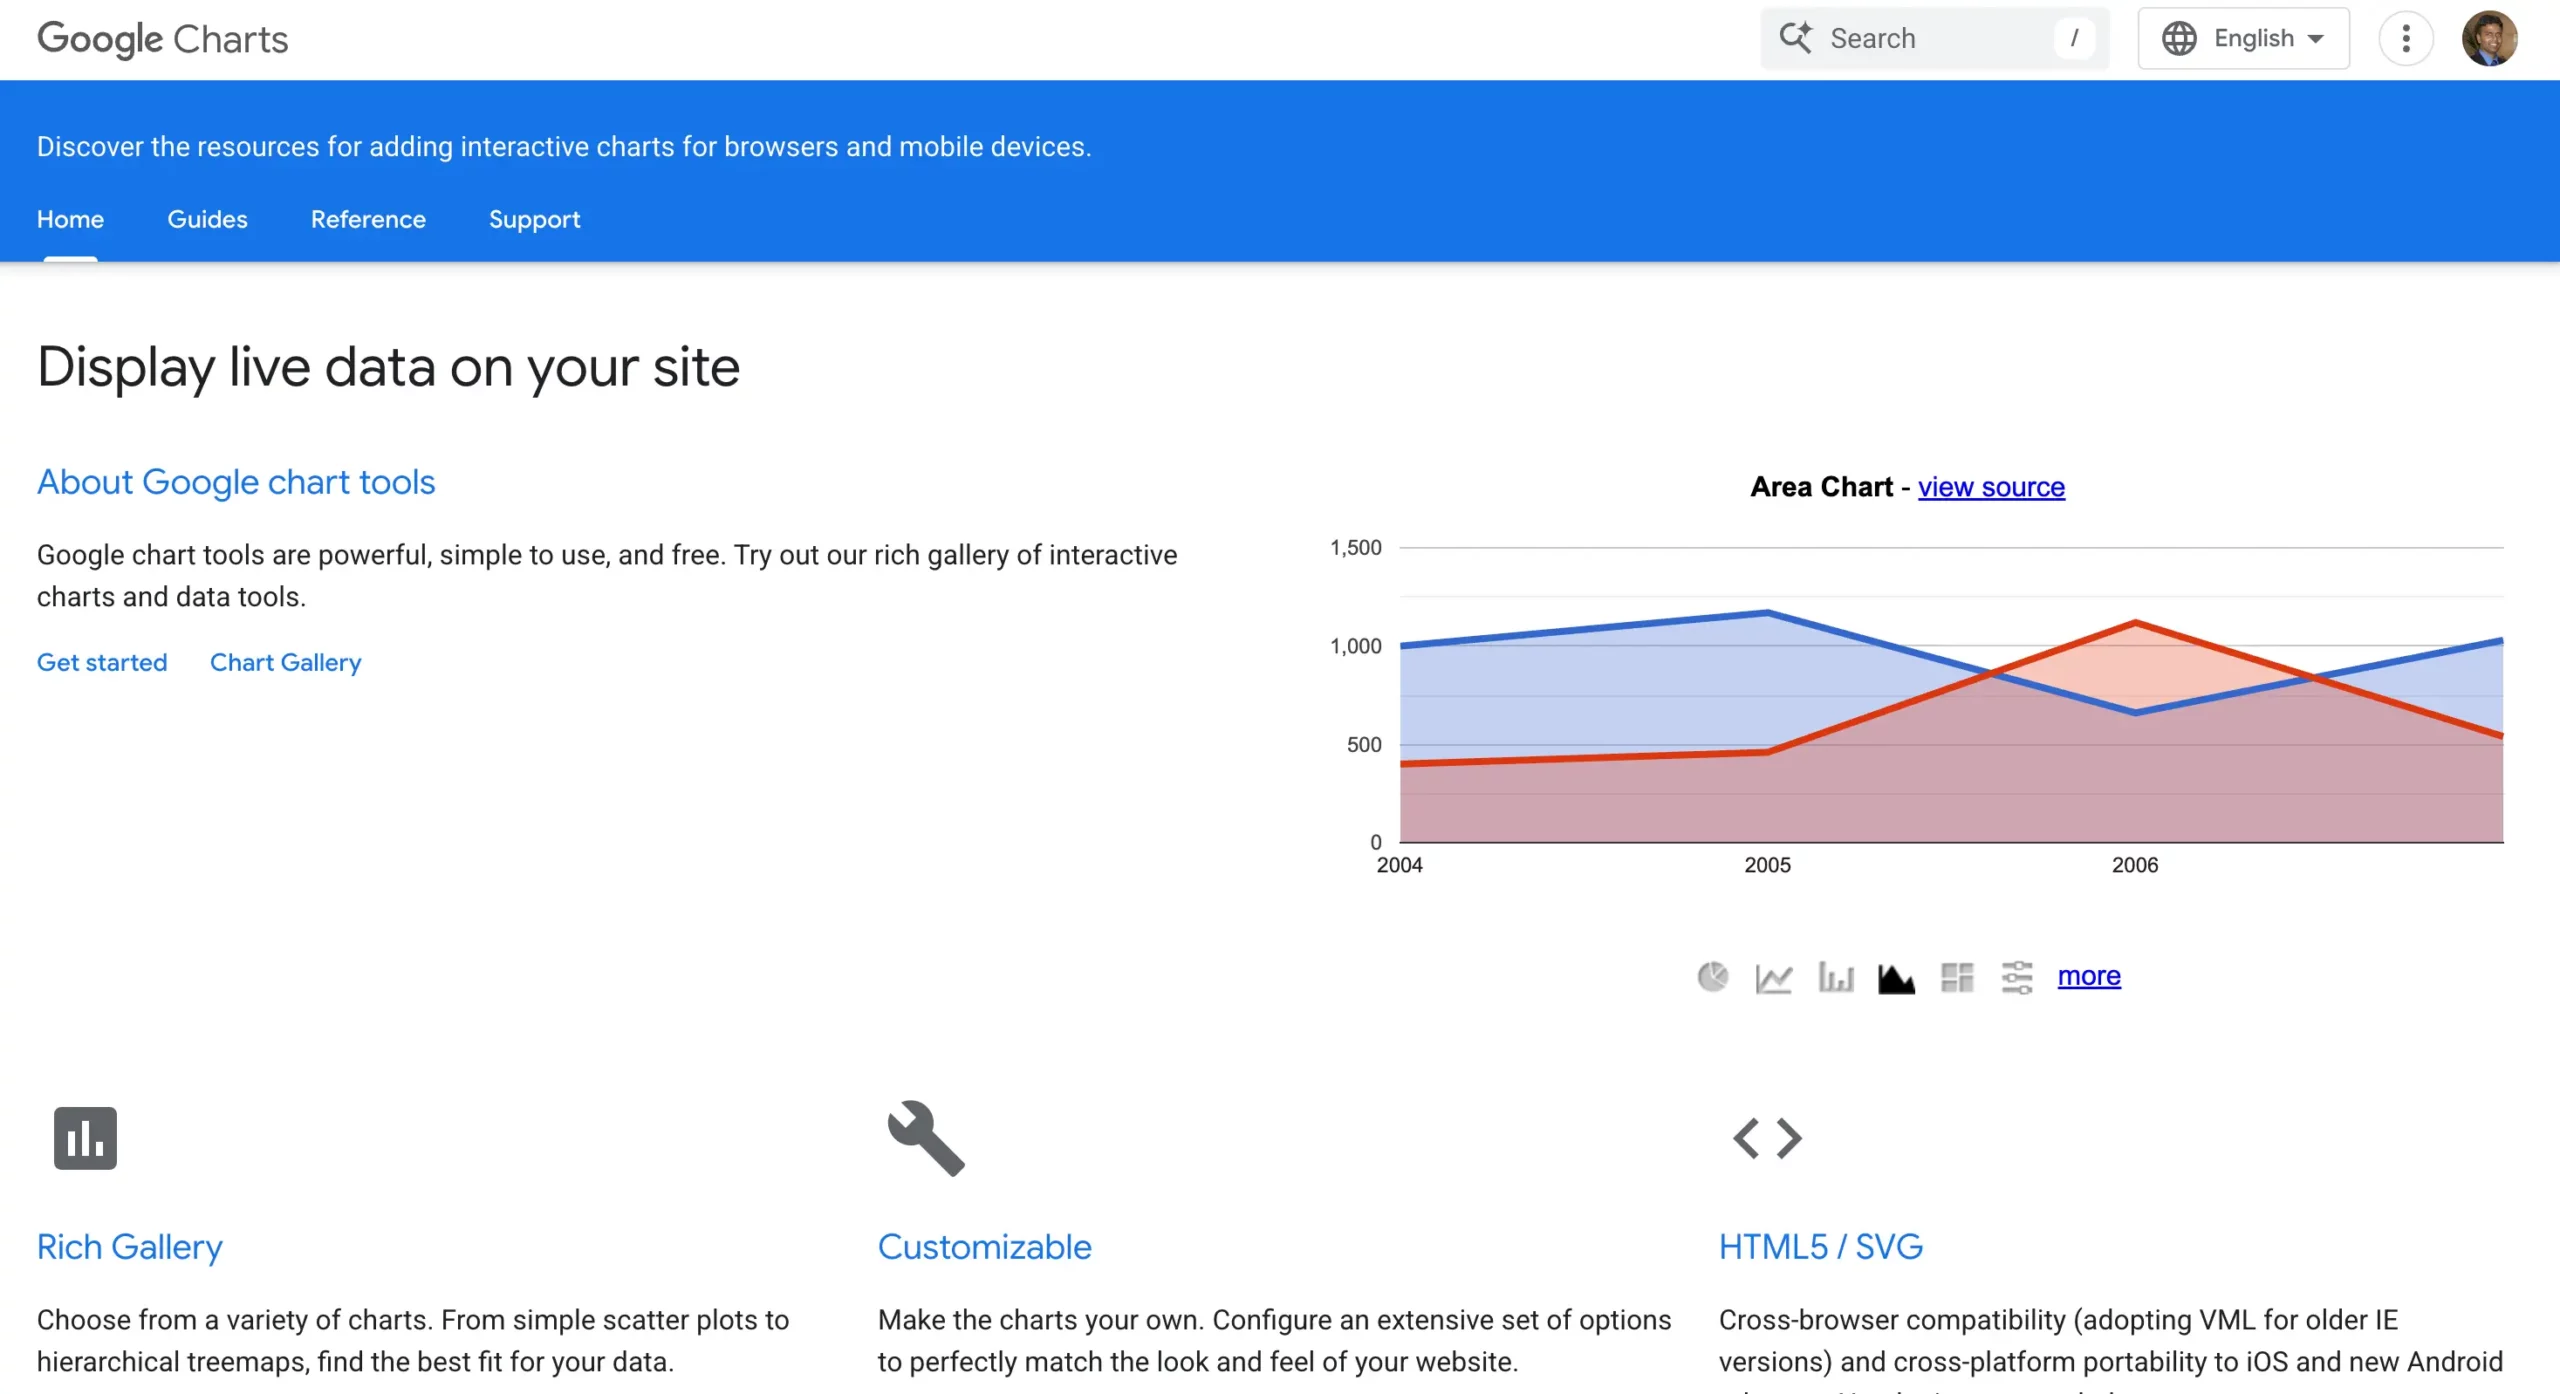
Google Charts is a free JavaScript charting library that allows developers to create interactive charts using data from a variety of sources. Backed by Google’s infrastructure, the library is known for its reliability, ease of use, and straightforward implementation.
The library supports many common chart types, including bar charts, line charts, pie charts, geo charts, and timelines. Because it is cloud-hosted, developers can get started quickly without managing large charting packages or complex dependencies. This makes Google Charts a practical choice for simple dashboards, reports, and data-driven websites.
Best Used For
- Small business dashboards
- Internal reporting tools
- Educational projects
- Data-driven websites
- Applications that need basic charting functionality
Pros
- Free to use
- Quick and easy to implement
- Wide selection of standard chart types
- Interactive features such as tooltips and filtering
- Reliable and well-documented
- Integrates easily with Google products and services
Cons
- Limited customization compared to advanced charting libraries
- Fewer enterprise-focused features
- Reliance on Google’s hosted services
- Not ideal for highly complex dashboards or large-scale analytics platforms
- Smaller selection of advanced chart types
Pricing & Licensing
Google Charts is free to use and does not require a commercial license. However, developers should review Google’s terms of service and usage policies before deploying large-scale commercial applications.
JavaScript Charting Library Comparison Table
The charting libraries above all have their strengths, but choosing the right one depends on your project’s requirements. The table below provides a quick side-by-side comparison of the top options, including their ideal use cases, rendering technologies, licensing models, framework support, and enterprise readiness.
| Library | Best For | Rendering Engine | License Type | Framework Wrappers | Enterprise Ready? |
|---|---|---|---|---|---|
| FusionCharts | Enterprise dashboards, BI platforms, financial reporting | SVG + Canvas | Commercial | React, Vue, Angular | ✅ Yes |
| Chart.js | Small projects, startup dashboards | Canvas | MIT (Open Source) | React, Vue, Angular (community wrappers) | ⚠️ Limited |
| D3.js | Custom visualizations, data storytelling | SVG, Canvas, HTML | ISC (Open Source) | Framework-agnostic | ⚠️ Requires custom development |
| Highcharts | Business dashboards, reporting platforms | SVG | Commercial | React, Vue, Angular | ✅ Yes |
| Apache ECharts | Analytics dashboards, large datasets | Canvas, SVG | Apache 2.0 (Open Source) | React, Vue, Angular | ✅ Yes |
| ApexCharts | SaaS dashboards, admin panels | SVG | Free & Commercial | React, Vue, Angular | ⚠️ Moderate |
| Recharts | React applications | SVG | MIT (Open Source) | React only | ❌ No |
| Plotly.js | Scientific and statistical visualizations | SVG, WebGL | MIT (Open Source) | React and other frameworks | ✅ Yes |
| amCharts | Interactive reports, maps, timelines | SVG, Canvas | Free & Commercial | React, Vue, Angular | ✅ Yes |
| Google Charts | Basic web charts and reports | SVG | Free | Framework-agnostic | ❌ No |
Key Takeaway: If you need a simple and free solution, Chart.js or ApexCharts are good starting points. For highly customized visualizations, D3.js remains the most flexible option. Teams building enterprise dashboards, financial applications, or business intelligence platforms should look at solutions such as FusionCharts, Highcharts, or Apache ECharts, which offer stronger scalability, advanced chart types, and long-term support.
Why FusionCharts Is the Preferred Choice for Enterprise-Grade Web Apps
Many charting libraries work well for basic visualizations. However, enterprise applications often require advanced chart types, large datasets, long-term reliability, and dedicated support. FusionCharts is designed to meet those needs.
Complete Visualization Platform
FusionCharts includes over 100 chart types, 2,000+ maps, gauges, and advanced visualizations in a single package. This helps teams avoid managing multiple libraries and reduces development complexity.
Built for Enterprise Environments
Enterprise applications must work consistently across different browsers, devices, and operating systems. FusionCharts offers strong cross-browser compatibility and a mature platform that organizations can rely on for business-critical applications.
Professional Support
Unlike many open-source alternatives, FusionCharts provides dedicated commercial support, regular updates, and detailed documentation. This gives development teams a reliable path to resolving issues and delivering projects faster.
For organizations building SaaS platforms, BI dashboards, financial applications, or executive reporting tools, FusionCharts offers a balance of functionality, scalability, and support that few charting libraries can match.
Conclusion & Next Steps
The best JavaScript charting library depends on the complexity of your data, your performance requirements, and the scale of your application. Lightweight libraries such as Chart.js and ApexCharts are excellent for smaller projects, while tools like D3.js provide unmatched flexibility for custom visualizations. For larger dashboards and enterprise applications, factors such as advanced chart types, scalability, long-term support, and framework compatibility become increasingly important.
If your team is building business intelligence platforms, financial dashboards, SaaS analytics tools, or other data-intensive applications, FusionCharts offers a complete solution with enterprise-grade features, extensive chart options, and dedicated support.
For scalable, responsive, and production-ready dashboards that don’t compromise on performance, download a free trial of FusionCharts today.
FAQs
What is the best JavaScript charting library?
The best JavaScript charting library depends on your needs. Chart.js is ideal for simple and free projects, while FusionCharts and Highcharts are better suited for enterprise dashboards, reporting tools, and business applications.
Which JavaScript charting library handles large datasets best?
FusionCharts, Apache ECharts, and Plotly.js are strong choices for large datasets. Their Canvas and WebGL rendering capabilities help maintain performance in data-intensive applications.
Are there free charting libraries for JavaScript?
Yes. Popular free JavaScript charting libraries include Chart.js, Apache ECharts, D3.js, Recharts, and Plotly.js. However, commercial libraries often provide dedicated support and enterprise-focused features.