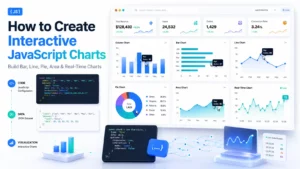
You can build complex web applications easily with Angular. But it’s a challenge to present data effectively in these applications. Modern applications mainly rely on charts to display trends, monitor performance, and help users explore large datasets.
Finding an Angular chart library is not the problem. The challenge is to choose the best Angular chart library from the dozens of available options in the market.
Different charting libraries focus on different features. Some of them prioritize simplicity and quick implementation. Advanced data visualizations, real-time updates, and enterprise dashboard features are the other important features that other libraries focus on.
However, the best choice depends on your project’s requirements, budget, and long-term maintenance needs. Let’s compare the leading Angular chart libraries in 2026 in this article while exploring the areas where each one excels.
Table of Contents
Key Takeaways
- The best Angular chart library depends on your project’s size, data complexity, budget, and long-term maintenance needs.
- FusionCharts is a strong choice for enterprise dashboards, business intelligence platforms, financial reporting tools, and production-grade Angular applications.
- Chart.js with ng2-charts is better suited for smaller Angular projects that need simple, lightweight charts.
- Apache ECharts is a powerful open-source option for advanced visualizations and large datasets.
- D3.js offers the most flexibility, but it requires more manual coding and visualization expertise.
- Before choosing a charting library, compare Angular integration, chart variety, performance, real-time data support, accessibility, customization, documentation, and licensing.
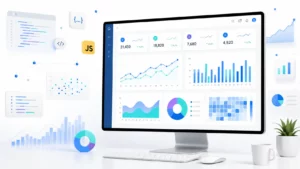
What Is an Angular Chart Library?
An Angular chart library is a collection of charting components. It allows you to create data visualizations within Angular applications. These libraries simplify the process of building interactive charts. They provide ready-made components, responsive layouts, and built-in features such as tooltips, zooming, drill-downs, and real-time updates.
You can use Angular chart libraries to build:
- SaaS analytics dashboards
- Financial reporting applications
- Healthcare monitoring systems
- E-commerce analytics platforms
- IoT and real-time monitoring dashboards
Most modern charting libraries support a variety of data visualization types from simple bar charts to complex gauges, and sankey diagrams. Instead of building charts from scratch, you can use a charting library to reduce development time, improve performance, and deliver a better user experience.
Before choosing an Angular chart library, it’s important to understand the features that matter most for your application. Let’s look at the key factors to consider.
What Should You Look for in an Angular Chart Library?
All Angular chart libraries are not built for the same purpose. They prioritize different features. Before choosing a library, you should consider the following factors.
Ease of Angular Integration
A good Angular chart library should integrate smoothly with Angular projects. Look for libraries that provide dedicated Angular wrappers and clear installation instructions. Also check if they support the latest Angular versions.
When you spend less time configuring charts, you have more time to focus on building your application.
Chart Variety
Different projects require different visualization types. While most libraries support basic charts, more advanced applications may need additional visualization options.
Look for support for:
- Bar charts
- Line charts
- Pie and doughnut charts
- Area charts
- Heatmaps
- Gantt charts
- Maps
- Gauges
Choosing a library with a broad range of chart types can prevent the need to introduce additional visualization tools later.
Performance at Scale
Performance becomes increasingly important as datasets grow. Some charting libraries handle thousands of data points efficiently. Some of them may struggle with large or frequently updated datasets.
If you’re building analytics dashboards or enterprise applications, consider how the library performs under real-world workloads.
Real-Time Data Support
Applications that display live metrics often require charts that update continuously without affecting performance.
If your project involves monitoring systems, financial data, IoT devices, or operational dashboards, look for a library that supports smooth real-time updates and dynamic data binding.
Accessibility
Accessibility is often overlooked during library selection. Features such as keyboard navigation, screen-reader compatibility, and compliance with accessibility standards can improve usability for a wider audience and help meet organizational requirements.
Customization
Every application has unique design requirements. A flexible charting library should allow you to customize colors, labels, tooltips, legends, and animations. Also you can customize the chart behavior without extensive workarounds.
When your charting library provides more control, it becomes easier to align charts with your application’s design system.
Documentation and Community
Comprehensive documentation can significantly reduce development time. Look for libraries that provide detailed guides, code examples, API references, and active community support.
Strong documentation often makes the difference between a smooth implementation and a frustrating development experience.
Licensing and Pricing
Licensing requirements vary widely between charting libraries. Some are completely open source, while others require commercial licenses for production use.
Before making a decision, evaluate the licensing model, pricing structure, and any restrictions that may apply to your project. The cheapest option isn’t always the most cost-effective if it lacks the features or support your team needs.
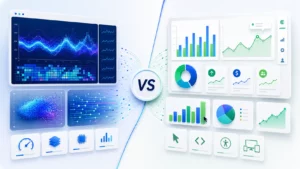
Best Angular Chart Libraries Compared
You can find dozens of charting libraries that work with Angular. The difficult part is figuring out which one fits your requirements. A library that works well for a simple reporting page may not be suitable for a large analytics platform. Also a tool designed for enterprise dashboards could be excessive for a smaller project.
The following libraries are among the most widely used options available today. Each has its own strengths, trade-offs, and ideal use cases.
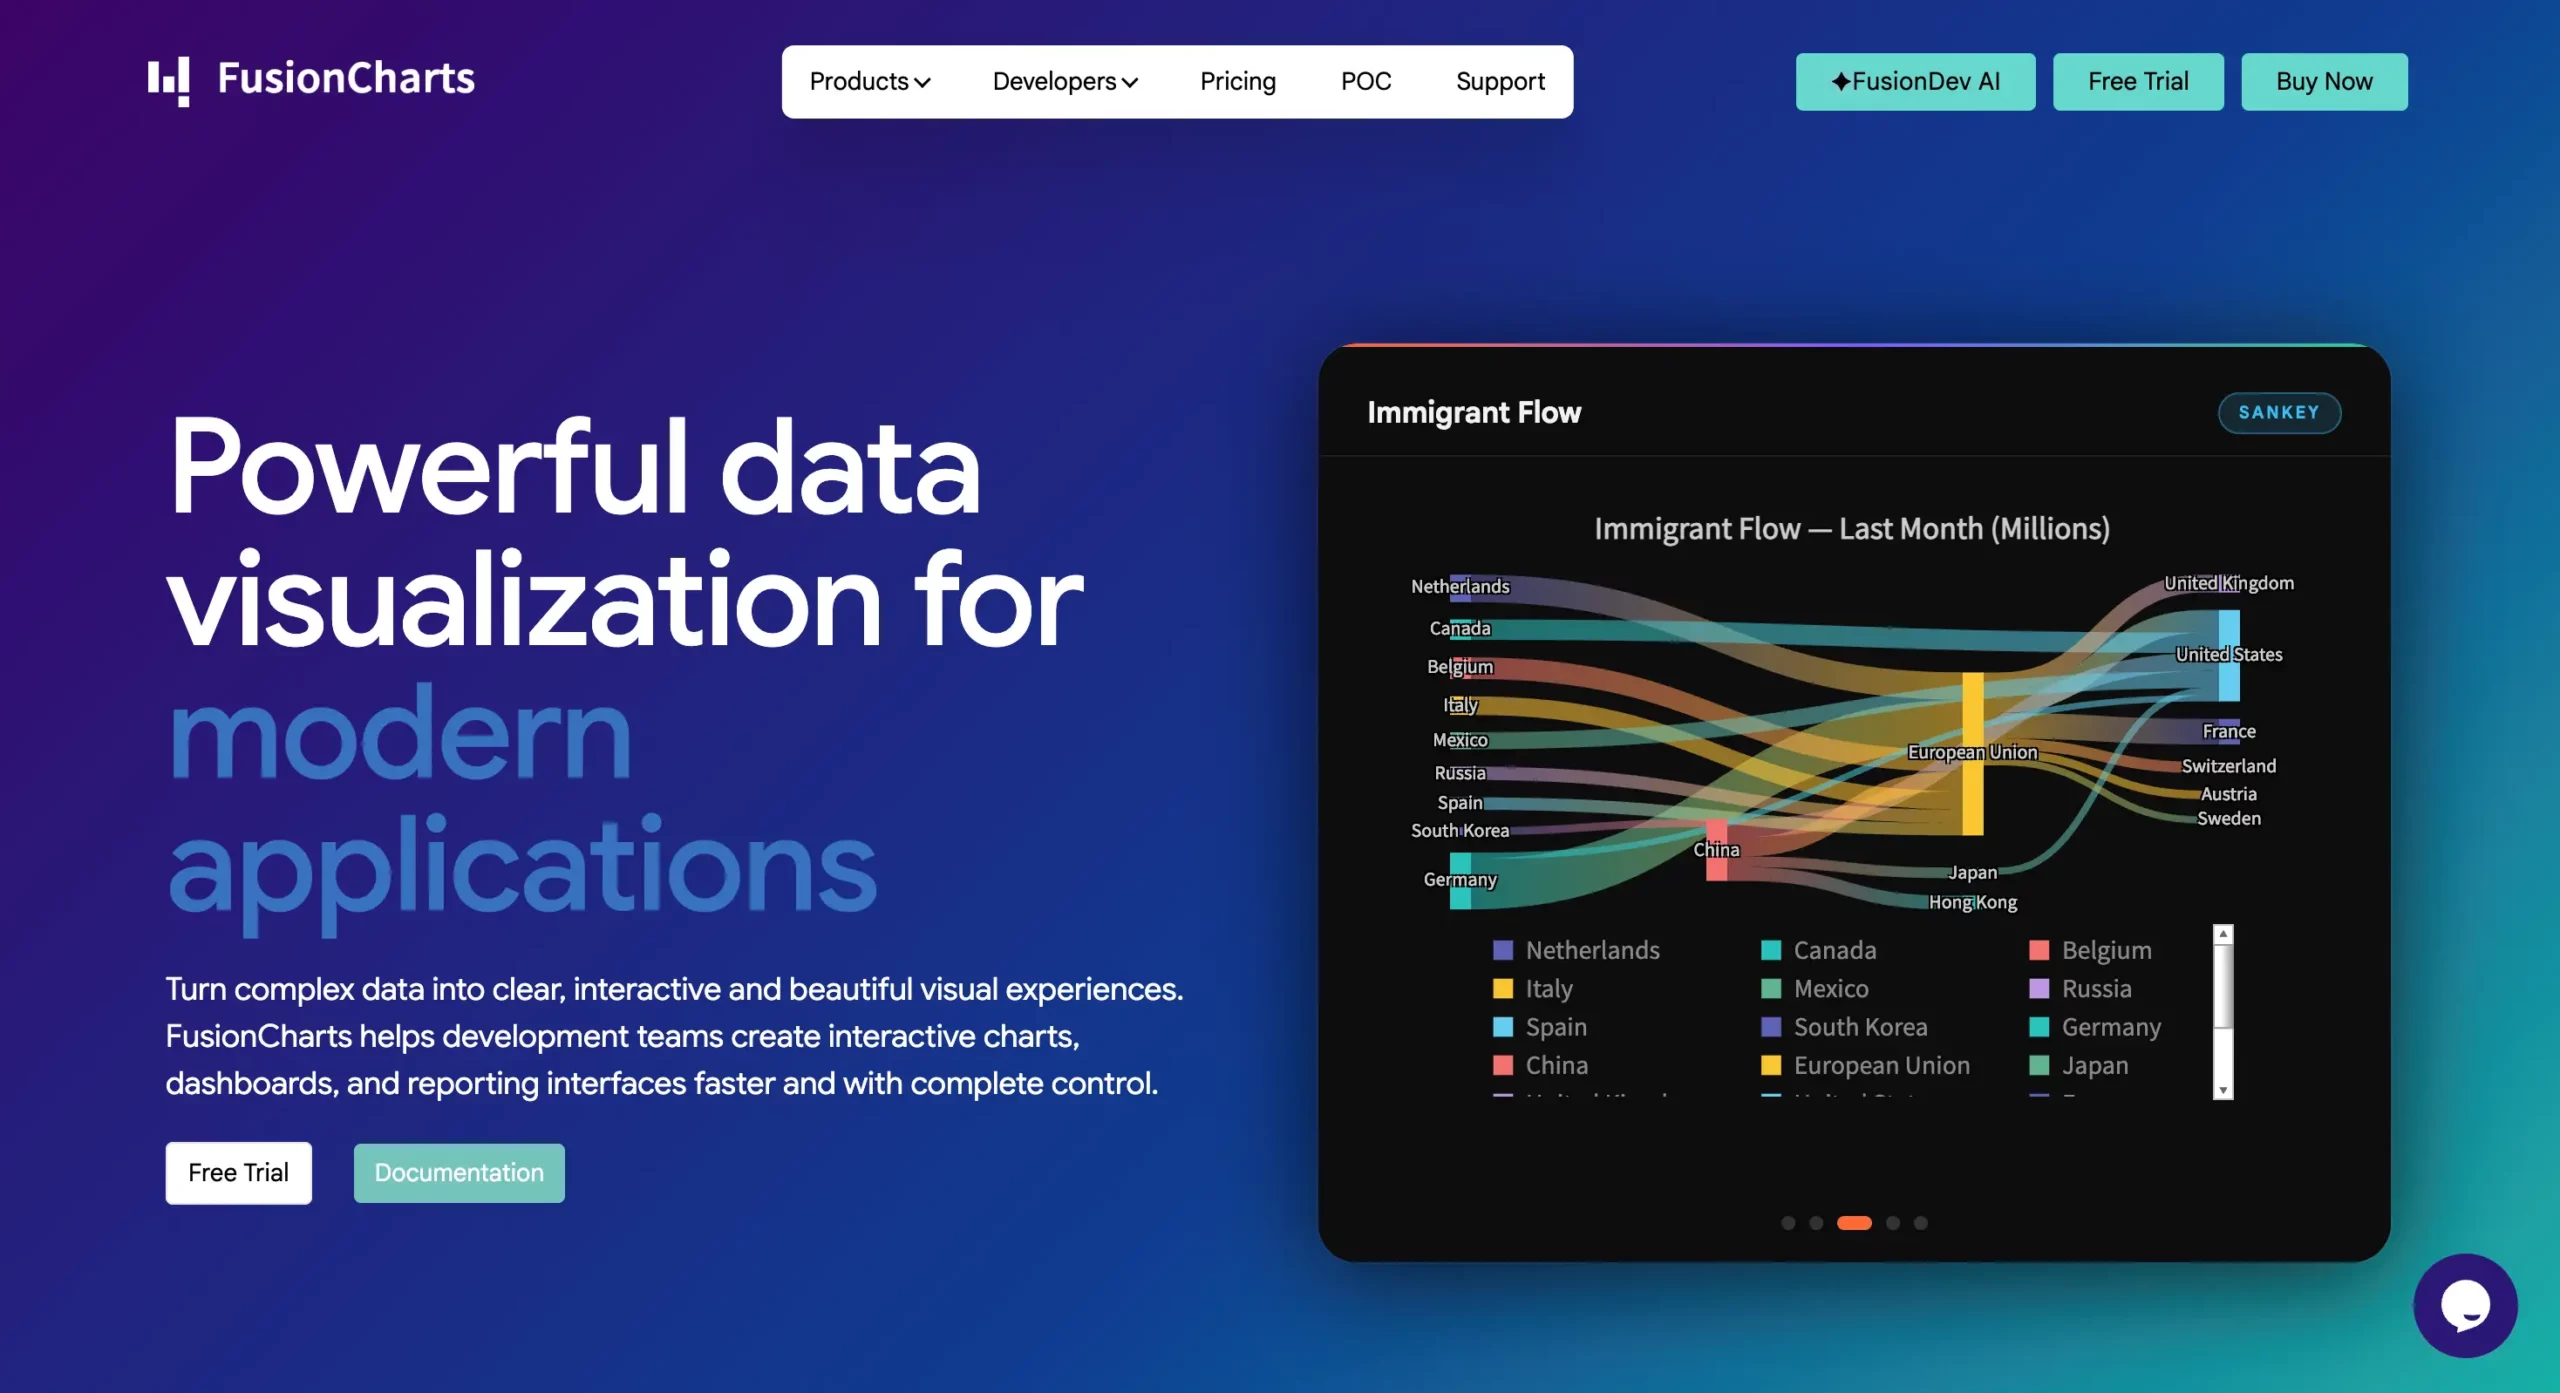
FusionCharts
FusionCharts is a commercial charting library designed for dashboards, reporting systems, and enterprise applications. It offers extensive Angular support and one of the largest collections of chart types available.
Basic Installation
Run the following command to install the FusionCharts package via npm.
npm install fusioncharts angular-fusioncharts --save
Then import FusionCharts library and chart modules to get started.
Key Features
- Angular integration
- 100+ chart types
- Time-series charts
- Interactive dashboards
- Maps and geospatial visualizations
- Gantt charts
- Real-time updates
- Exporting and printing support
Pros
- Extensive chart collection
- Includes maps and Gantt charts
- Enterprise-ready features
- Strong documentation and support
- Suitable for large dashboard projects
Cons
- Commercial license required
- More features than smaller projects may need
Pricing
Commercial license with multiple plans based on usage and deployment requirements.
Best For
Enterprise dashboards, business intelligence platforms, financial reporting systems, and large-scale business applications.
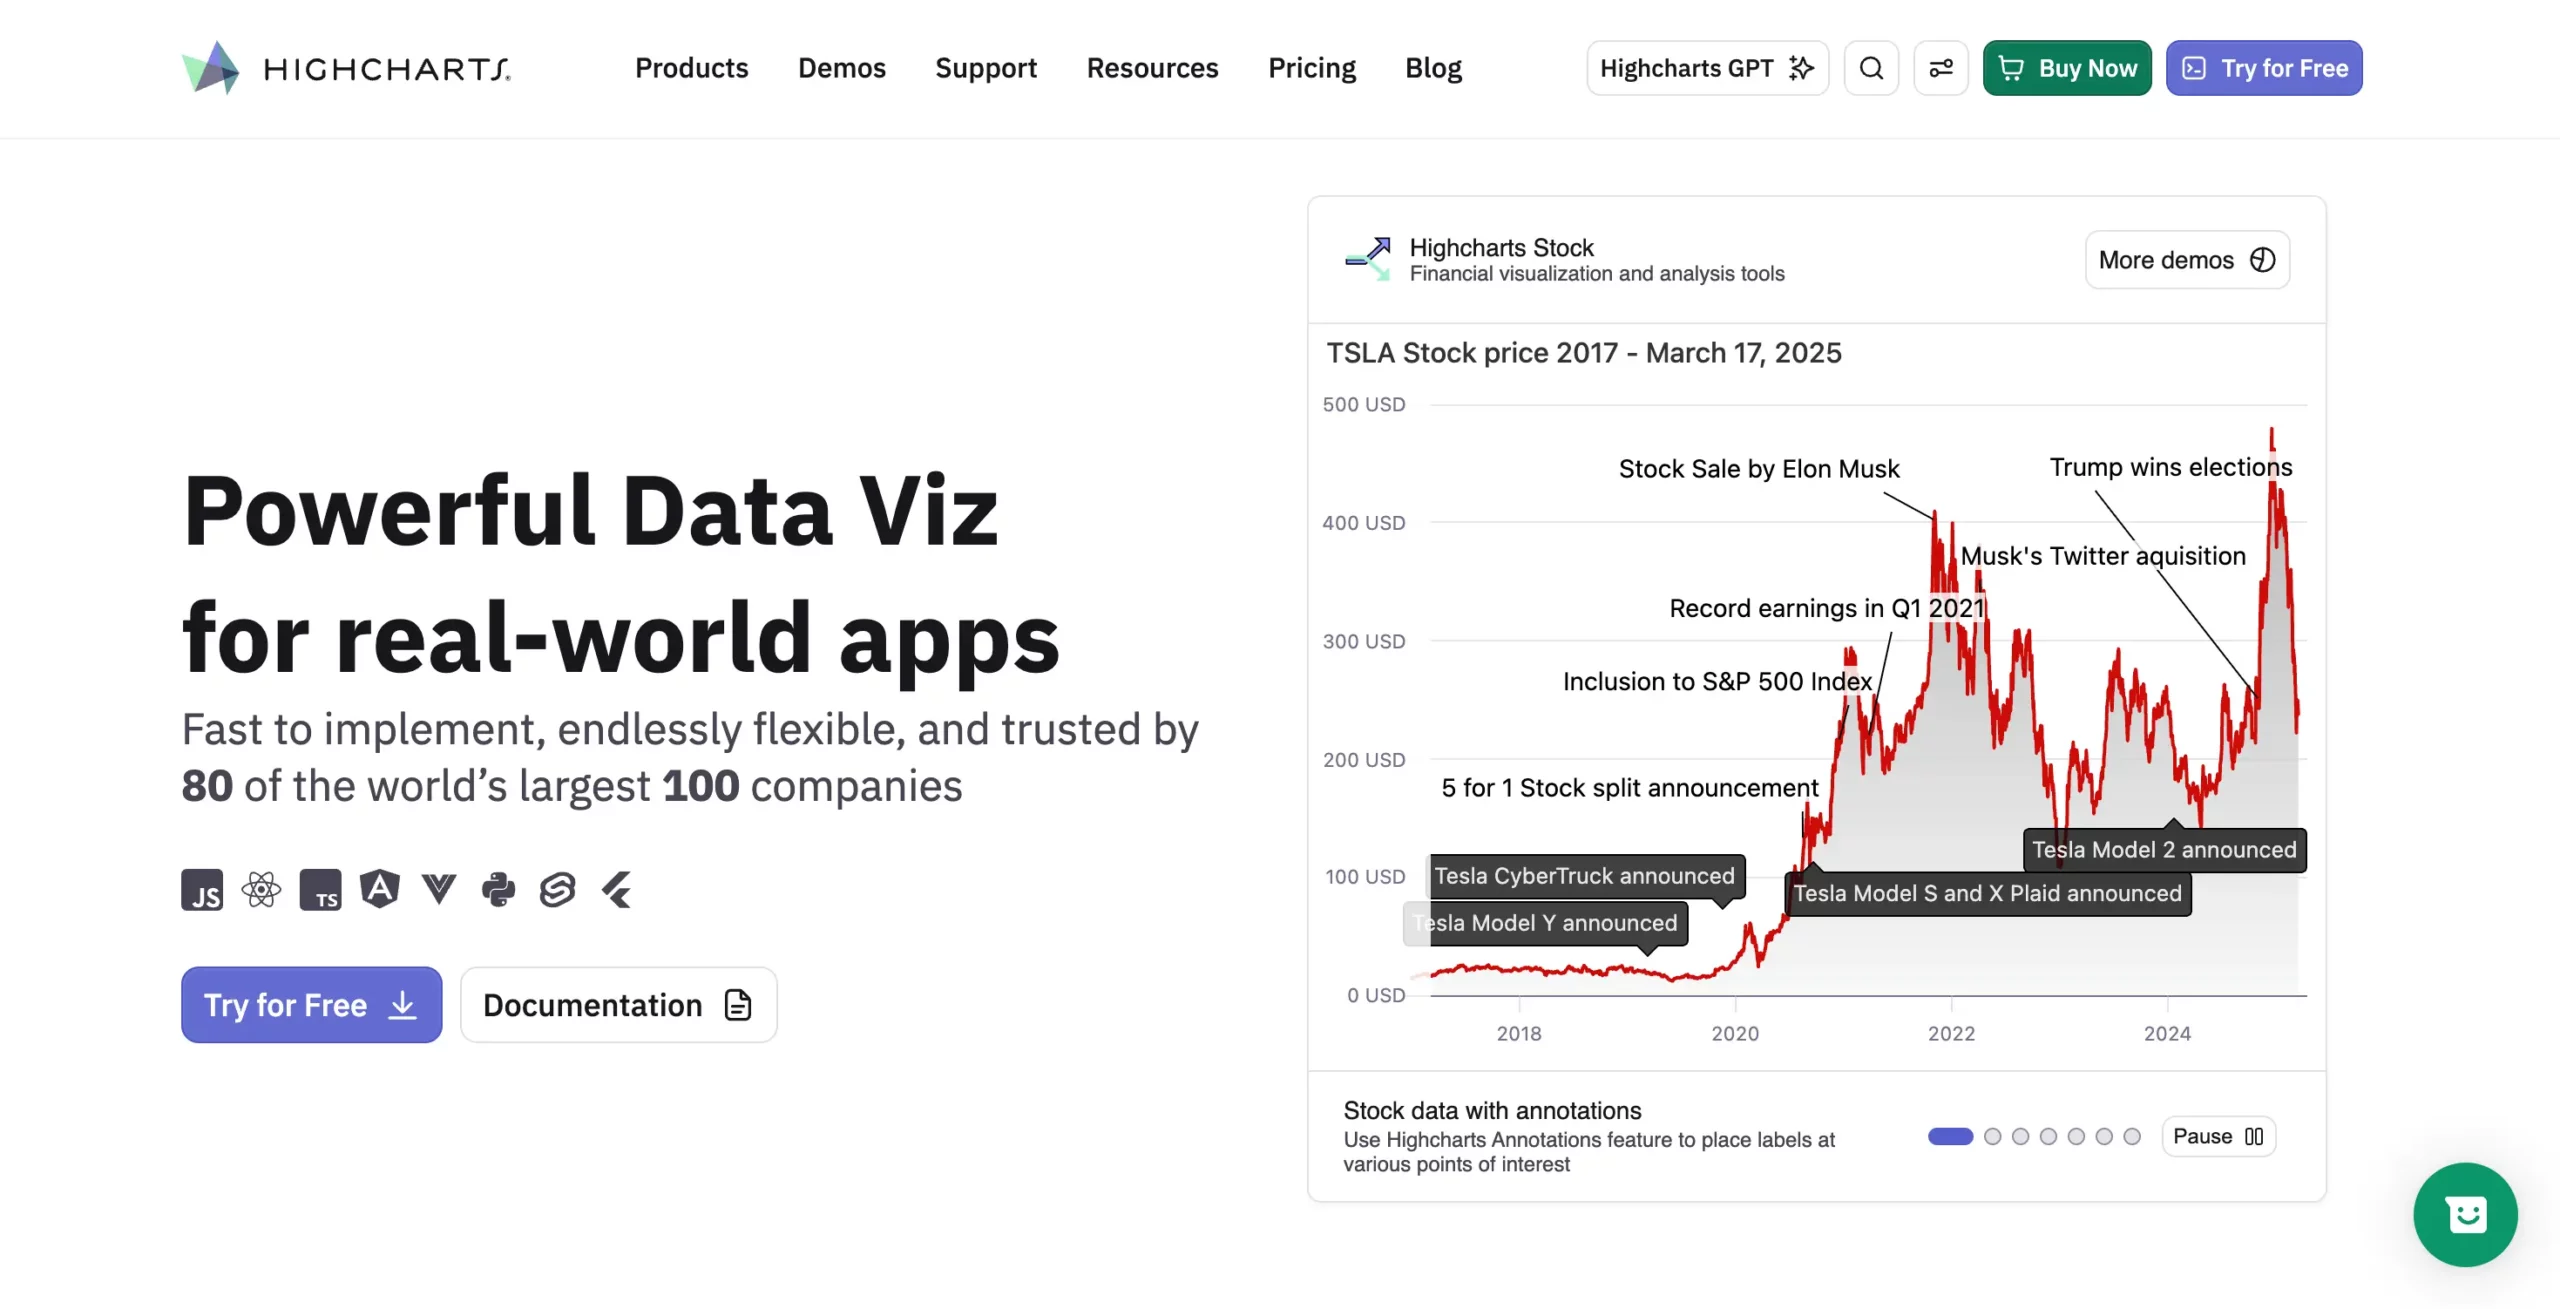
Highcharts
Highcharts is a mature charting library known for its flexibility, polished visualizations, and extensive customization capabilities.
Basic Installation
Install Highcharts as a Node module and save it as a dependency in your package.json.
npm install highcharts --save
Then import the HighchartsChartModule into your app.
Key Features
- Angular integration
- Wide range of chart types
- Advanced customization
- Accessibility support
- Exporting tools
- Interactive charts and dashboards
Pros
- Highly customizable
- Strong accessibility features
- Large community and ecosystem
- Professional-looking visualizations
Cons
- Commercial license required for most business use cases
- Can be complex for beginners
Pricing
Free for non-commercial use. Commercial licenses required for business applications.
Best For
Interactive business applications and organizations that require extensive chart customization.
Apache ECharts
Apache ECharts is an open-source charting library that offers advanced visualization capabilities and strong performance when working with large datasets.
Basic Installation
You can install ECharts via npm using the following command:
npm install echarts
Then simply import echarts to include all ECharts functionality.
Kay Features
- Open-source license
- Heatmaps and treemaps
- Geographic maps
- Network graphs
- Large dataset support
- Rich animation capabilities
Pros
- Free and open source
- Excellent visualization variety
- Handles large datasets well
- Active community support
Cons
- Angular integration requires additional setup
- Learning curve can be steeper than simpler libraries
Pricing
Free under the Apache 2.0 license.
Best For
Advanced visualizations, analytics platforms, and data-intensive applications.
Chart.js
Chart.js is one of the most widely used JavaScript charting libraries. It focuses on simplicity, ease of use, and lightweight implementation.
Basic Installation
Install ng2-charts and Chart.js using npm:
npm install ng2-charts chart.js
ng2-charts acts as an Angular wrapper for Chart.js, allowing developers to use Chart.js charts through Angular-friendly directives such as baseChart.
Key Features
- Simple API
- Responsive charts
- Common chart types
- Animation support
- Extensive plugin ecosystem
Pros
- Easy to learn
- Quick implementation
- Lightweight
- Large developer community
Cons
- Limited advanced chart types
- No built-in maps or Gantt charts
- Less suitable for complex dashboards
Pricing
Free and open source under the MIT license.
Best For
Small to medium-sized projects, internal tools, and applications with basic visualization requirements.
ApexCharts
ApexCharts is a modern charting library that focuses on interactive visualizations and dashboard experiences.
Basic Installation
ng-ApexCharts is an Angular wrapper component for ApexCharts to be integrated into your Angular application. You can install it using npm as below:
npm install apexcharts ng-apexcharts --save
Then add the code below to your angular.json under scripts:
"scripts": [

  "node_modules/apexcharts/dist/apexcharts.min.js"

]
Next, add ng-apexcharts-module to imports:
imports: [

  BrowserModule,

  FormsModule,

  ReactiveFormsModule,

  NgApexchartsModule,

  ...

]
Key Features
- Angular integration
- Interactive charts
- Zooming and panning
- Annotations
- Responsive layouts
- Real-time updates
Pros
- Modern chart designs
- Easy to implement
- Strong dashboard capabilities
- Good developer experience
Cons
- Smaller chart collection than some competitors
- Limited specialized chart types
Pricing
Free for open-source projects. Commercial licensing available for business use.
Best For
Modern web applications, SaaS platforms, and analytics dashboards.
D3.js
D3.js is a powerful data visualization framework that provides complete control over how visualizations are built and rendered.
Basic Installation
D3.js can be integrated into Angular apps, but it is not a ready-made Angular chart library. It is best suited for teams that need highly custom visualizations and are comfortable writing more visualization logic manually.
You can install D3.js via npm as below:
npm install d3
For TypeScript support, developers may also install:
npm install --save-dev @types/d3
Main Features
- SVG and Canvas rendering
- Data-driven visualizations
- Custom chart creation
- Animation support
- Advanced interaction capabilities
Pros
- Extremely flexible
- Supports virtually any visualization
- Large ecosystem and community
- Ideal for custom projects
Cons
- Steep learning curve
- Requires significantly more development effort
- No ready-made chart components
Pricing
Free and open source under the ISC license.
Best For
Custom visualizations, data storytelling projects, and highly specialized charting requirements.
Angular Chart Library Comparison Table
The best Angular chart library depends on what you are building. Some tools are better for simple charts, while others are stronger for enterprise dashboards, real-time data, maps, or custom visualizations.
| Library | Angular Support | Chart Types | Real-Time Updates | Maps | Gantt | Accessibility | License |
|---|---|---|---|---|---|---|---|
| FusionCharts | Dedicated Angular integration | 100+ chart types | Yes | Yes | Yes | Yes | Commercial |
| Highcharts | Official Angular wrapper | Wide range, including charts, maps, stock, and Gantt | Yes | Yes | Yes | Strong accessibility support | Free for non-commercial use; commercial license required for business use |
| Apache ECharts | Works with Angular through wrappers or direct integration | 20+ built-in chart types with advanced components | Yes | Yes | No native Gantt focus | Some accessibility support, but may require extra configuration | Free, Apache 2.0 |
| Chart.js / ng2-charts | Angular wrapper available through ng2-charts | Common chart types such as bar, line, pie, doughnut, radar, scatter, and bubble | Possible with data updates | No built-in map charts | No | Basic accessibility support; may require additional work | Free, MIT |
| ApexCharts | Angular wrapper available through ng-apexcharts | Common dashboard charts, including line, area, bar, pie, heatmap, treemap, and more | Yes | Limited compared to map-focused libraries | No native Gantt focus | Basic accessibility support; may require extra configuration | Community and commercial license options |
| D3.js | Can be used in Angular, but requires manual integration | Virtually unlimited because charts are custom-built | Yes, with custom implementation | Yes, with custom implementation | Possible, but custom-built | Depends on implementation | Free, open source |
This comparison shows why there is no single “best” Angular chart library for every project. For small reporting pages, Chart.js with ng2-charts may be enough. For custom visualizations, D3.js gives the most flexibility. For enterprise dashboards that need a broad chart collection, maps, Gantt charts, and support, FusionCharts is a stronger fit.
Which Angular Chart Library Is Best for Your Use Case?
The best Angular chart library depends on your project size, data complexity, budget, and customization needs. Here is a quick breakdown.
Best for Enterprise Dashboards
Recommended option: FusionCharts
FusionCharts is a strong fit for enterprise dashboards because it supports a wide range of charts, maps, Gantt charts, gauges, time-series charts, and Angular integration. It also offers commercial support, which is useful for production applications.
Best for SaaS Analytics Platforms
Recommended options: FusionCharts, ApexCharts, or Highcharts
FusionCharts works well for feature-rich SaaS dashboards. ApexCharts is a good option for modern, lightweight analytics interfaces. Highcharts is suitable when deep customization is a priority.
Best for Financial Applications
Recommended options: FusionCharts or Highcharts
Financial applications often need time-series charts, real-time updates, KPI views, and export options. FusionCharts is useful for dashboard-heavy financial tools, while Highcharts is strong for highly customized financial visualizations.
Best for Small Projects
Recommended option: Chart.js with ng2-charts
Chart.js with ng2-charts is a practical choice for small Angular applications. It is lightweight, easy to set up, and supports common chart types such as bar, line, pie, doughnut, radar, scatter, and bubble charts.
Best for Custom Visualizations
Recommended option: D3.js
D3.js is best when you need full control over the final visualization. It can be used in Angular apps, but it requires more manual coding than ready-made chart libraries.
Best Open-Source Option
Recommended option: Apache ECharts
Apache ECharts is a strong open-source option for advanced Angular data visualization. It supports many chart types, performs well with large datasets, and is free to use under the Apache 2.0 license.
Final Thoughts
There is no single best Angular chart library for every project. The right choice depends on your data, budget, design needs, and application goals.
For small projects, Chart.js with ng2-charts is a simple option. For open-source data visualization, Apache ECharts is a strong choice. For custom visualizations, D3.js offers the most flexibility. Highcharts and ApexCharts are good options for polished interactive charts.
For enterprise dashboards, analytics platforms, and production-grade business applications, FusionCharts is worth considering. It offers Angular integration, 100+ chart types, maps, Gantt charts, gauges, time-series charts, real-time updates, and dashboard-ready features in one platform.
Explore FusionCharts to build interactive Angular charts faster and create scalable data visualizations for your next project.
FAQs
What is the best Angular chart library?
The best Angular chart library depends on your use case. FusionCharts is a strong choice for enterprise dashboards and business applications because it supports Angular integration, 100+ chart types, maps, Gantt charts, time-series charts, and commercial support.
Which Angular chart library is easiest to use?
Chart.js with ng2-charts is one of the easiest options for basic Angular charts. It is lightweight, simple to set up, and works well for common charts such as bar, line, pie, doughnut, radar, scatter, and bubble charts.
Are there free Angular chart libraries?
Yes. Chart.js, Apache ECharts, and D3.js are free and open source. However, they may require more setup, customization, or manual support compared to commercial charting libraries.
Which Angular chart library is best for dashboards?
FusionCharts is a strong option for Angular dashboards that need multiple chart types, maps, gauges, Gantt charts, real-time updates, and export options. ApexCharts is also a good option for lightweight dashboard interfaces.
Can I create real-time charts in Angular?
Yes. You can create real-time charts in Angular using libraries such as FusionCharts, Highcharts, ApexCharts, Apache ECharts, Chart.js, and D3.js. The setup and effort required depend on the library.
Does Angular have a built-in chart component?
No. Angular does not include a built-in chart component. Developers usually use third-party libraries such as FusionCharts, Highcharts, Apache ECharts, Chart.js with ng2-charts, ApexCharts, or D3.js.