If you are a developer and into data visualization, then a common question you’ll often here is: “Can Chart.js be used with React?”. The answer to this question is yes. However, this answer is not giving you a complete picture of any React chart. While you can create a charts in React with the Chart.js component, it may lack many of the desirable features that you get with a more powerful charting library. That React chart library is FusionCharts.
In this guide, we’ll show you how to create a React chart with both Chart.js and FusionCharts. This blog will convince you why you should prefer FusionCharts over Chart.js because of its many unique and great features.
Table of Contents
How can Chart.js be Used with React?
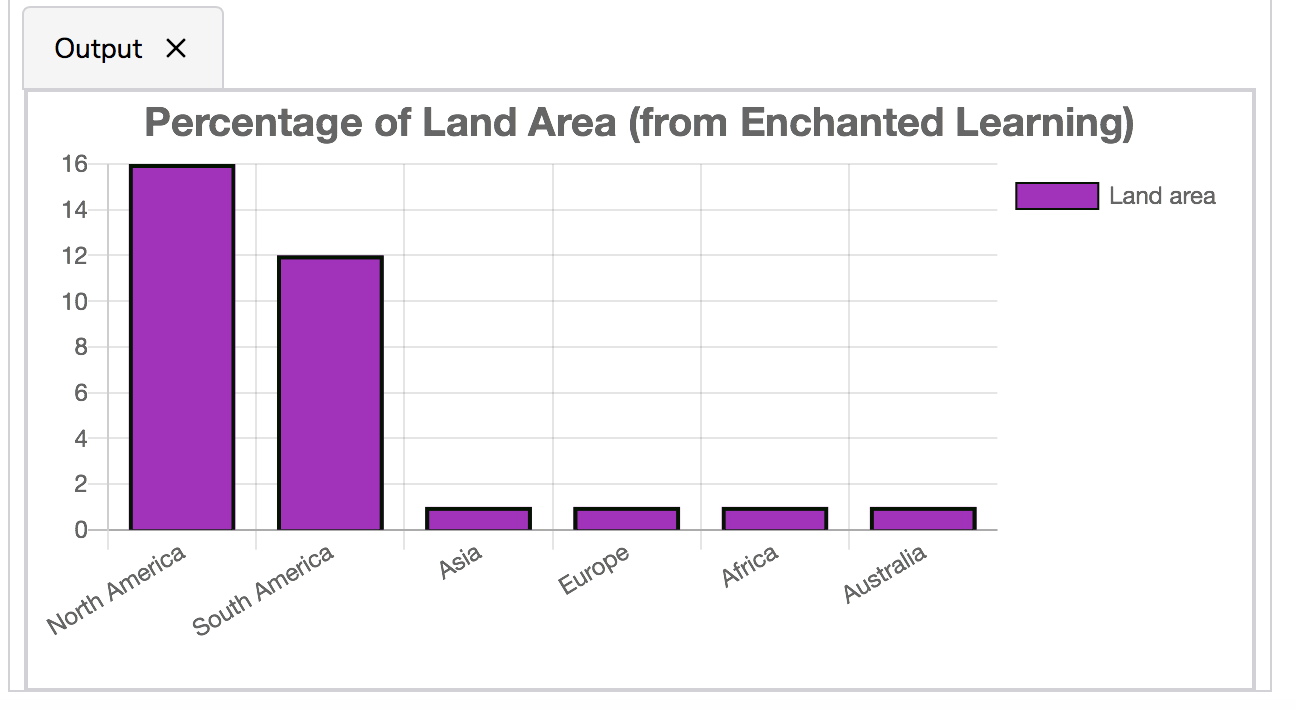
If you are looking to create a React chart using the Chart.js component, follow the given steps. After completing these steps, you’ll see the following chart:
Which Component should I Install to Create a React Chart Using Chart.js?
As a first step, to create a React chart using Chart.js, install the following library with peer dependencies. At the console type the following:
npm i react-chartjs-2 chart.jsHow do I Create a React Project for a React Chart in Chart.js?
To create a new React project, type the following at the console:
npx create-react-app chart-projectThe above command will create a new React project called chart-projectin a directory with the same name. Switch to this directory and run the app by typing:
npm startWhat are the Contents of App.js?
As a next step, open the App.js file in the src directory. In this file, specify the various properties of the bar chart as shown below.
import React from 'react';
import {Bar} from 'react-chartjs-2';

const state = {
  labels: ['North America', 'South America', 'Asia',
           'Europe', 'Africa', 'Australia'],
  datasets: [
    {
      label: 'Land area',
      backgroundColor: 'rgba(175,25,192,1)',
      borderColor: 'rgba(0,20,0,1)',
      borderWidth: 2,
      data: [16, 12, 1, 1, 1, 1]
    }
  ]
}

export default class App extends React.Component {
  render() {
    return (
      <div>
        <Bar
          data={state}
          options={{
            title:{
              display:true,
              text:'Percentage of Land Area (from Enchanted Learning)',
              fontSize:20
            },
            legend:{
              display:true,
              position:'right'
            }
          }}
        />
      </div>
    );
  }
}
What are the Contents of Index.js?
Open the index.js file, delete all its contents, and paste the following contents in this file.
import React from 'react';

import ReactDOM from 'react-dom';
import App from './app.js';

ReactDOM.render(
  <App />,
  document.getElementById('root')
);
Now if you refresh your browser at the page https://localhost:3000/, your bar chart created with Chart.js will show up.
Is There a Chart.js Alternative for React Chart?
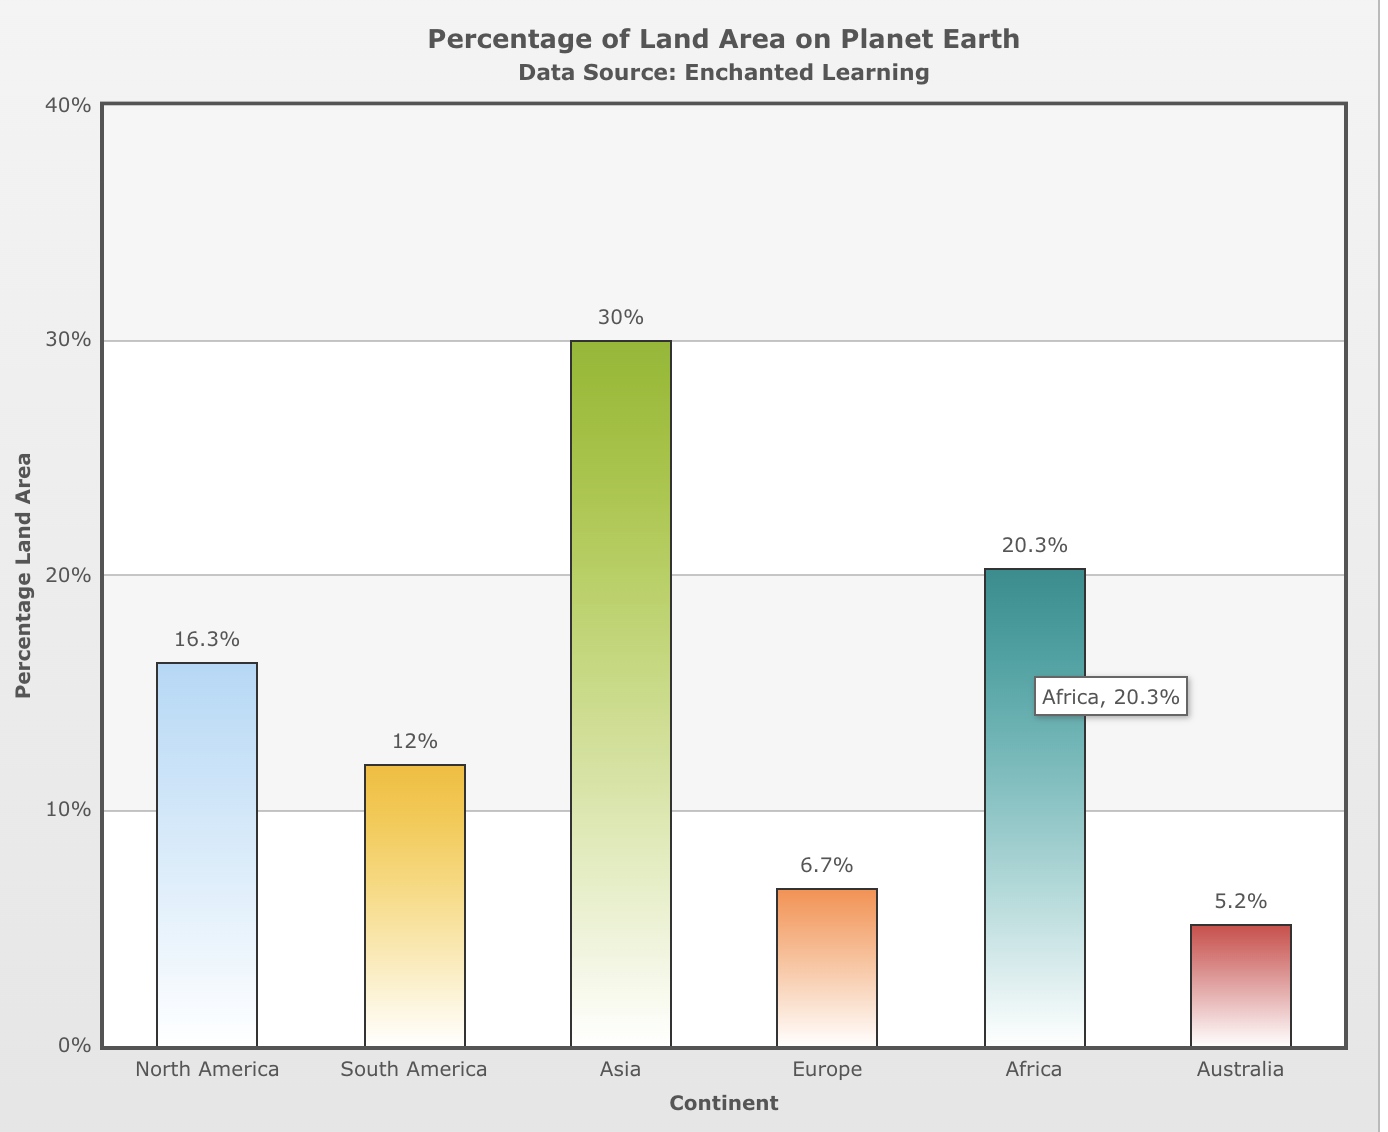
Indeed yes! There is a better alternative to using Chart.js for creating React native charts. You can create a financial pie chart, React line char, React gauge chart, React donut chart, or other data charts with FusionCharts. FusionCharts is the best React chart library out there. Moreover, it is very easy to create a chart or graph with FusionCharts. You can follow these steps to create a bar chart in FusionCharts.
First you can create a React project as described earlier. Next you can edit the App.js file as described below.
What are the Contents of App.js to Create a React Chart with FusionCharts?
Open the App.js file in the src folder, delete its contents, and paste the following code to it:
// *** Include Dependencies ***
// Include react
import React from "react";
import ReactDOM from "react-dom";

// Include the react-fusioncharts component
import ReactFC from "react-fusioncharts";

// Include the fusioncharts library
import FusionCharts from "fusioncharts";

// Include the chart type
import Column2D from "fusioncharts/fusioncharts.charts";

// Include the theme as fusion
import FusionTheme from "fusioncharts/themes/fusioncharts.theme.fusion";

// Adding the chart and theme as dependency to the core fusioncharts
// You can omit the components you don't need (column2D, FusionMaps, World)
ReactFC.fcRoot(FusionCharts, Column2D, FusionTheme);

// *** Add data source ***
const continentData = [
    {
      id: "NA",
      label: "North America",
      value: "16.3",
      showLabel: "1"

    },
    {
      id: "SA",
      label: "South America",
      value: "12.0",
      showLabel: "1"
    },
    {
      id: "AS",
      label: "Asia",
      value: "30.0",
      showLabel: "1"
    },
    {
      id: "EU",
      label: "Europe",
      value: "6.7",
      showLabel: "1"
    },
    {
      id: "AF",
      label: "Africa",
      value: "20.3",
      showLabel: "1"
    },
    {
      id: "AU",
      label: "Australia",
      value: "5.2",
      showLabel: "1"
    }
  ];


// *** Add JSON object for the React Graph configurations ***
const reactGraphConfigs = {
  type: "column2d", // The chart type
  width: "700", // Width of the chart
  height: "600", // Height of the chart
  dataFormat: "json", // Data type
  dataSource: {
    // Chart Configuration
    chart: {
       caption: "Percentage of Land Area on Planet Earth",
       subCaption: "Data Source: Enchanted Learning",
       xAxisName: "Continent",
       yAxisName: "Percentage Land Area",
       numberSuffix: "%",
       theme: "fusion"
    },
    // Chart Data
    data: continentData
  }
};


// *** Creating the DOM element to pass the react-fusioncharts component ***
class App extends React.Component {
  render() {
    //replace by reactGraphConfigs to display the bar chart
    return (<ReactFC {...reactGraphConfigs} />);
  }
}

export default App;
As you can see from the code, it is very easy to create a React chart using FusionCharts. All you have to do is specify the data points, along with the various chart configurations. The above code will render the following chart:
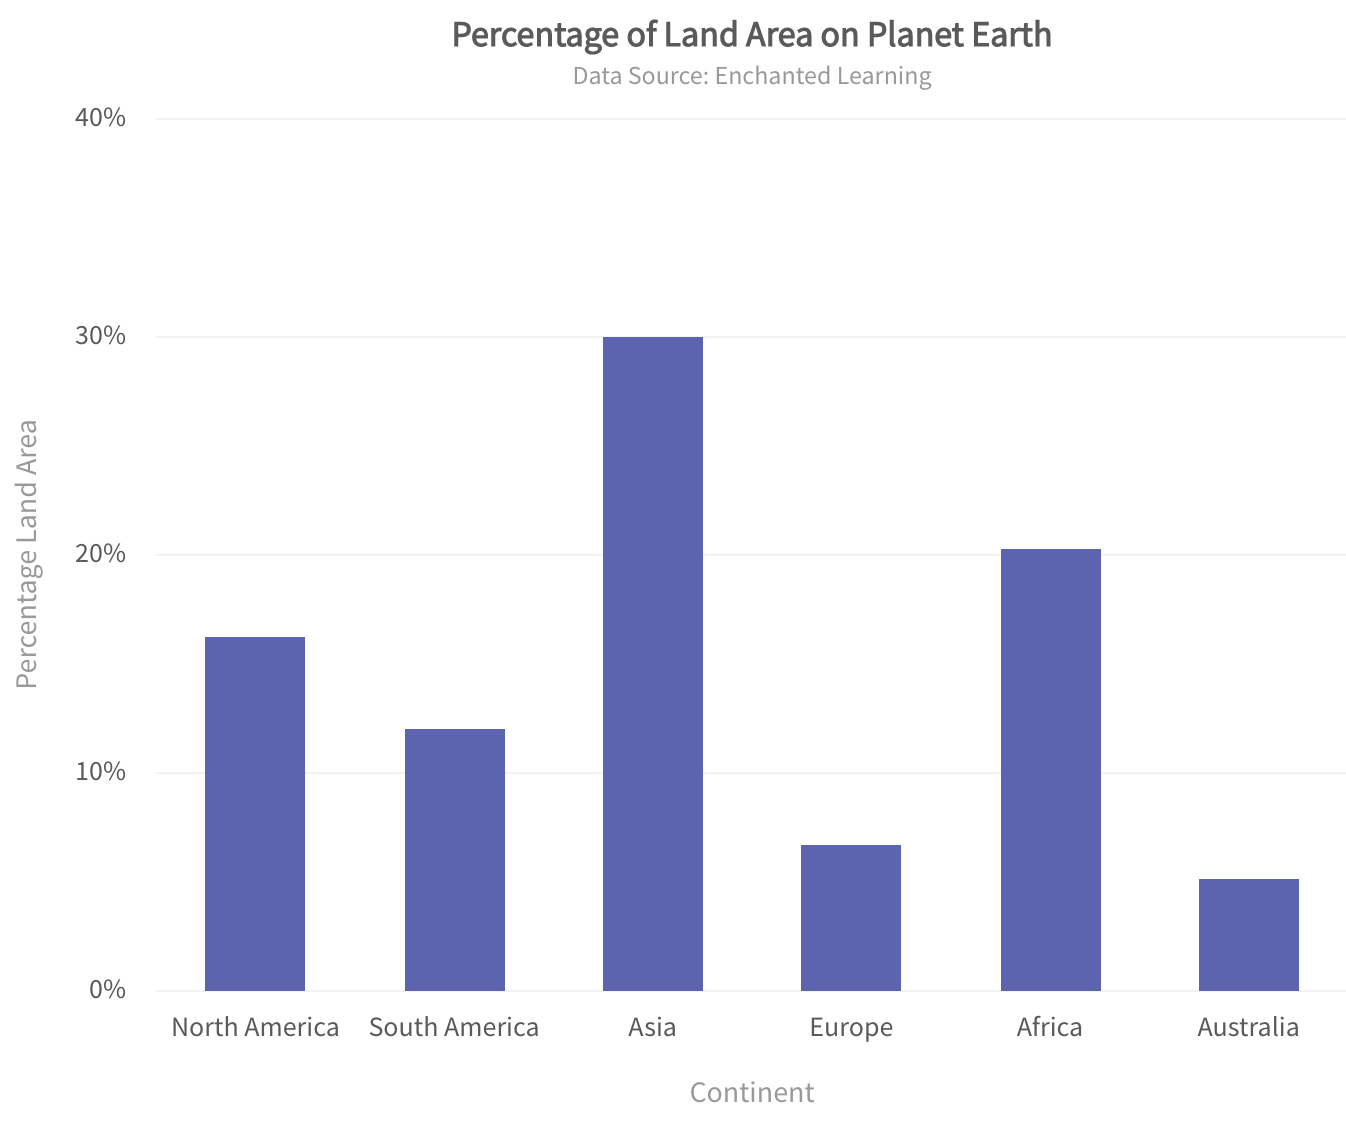
Changing the Color Schemes of React Chart in FusionCharts
If you want a different color scheme, simply change the theme. For example, you can set the fusion theme key in chart JSON as:
theme: "fusion"This displays the same chart using a different theme as shown below:
What is the Final Answer to Can Chart.js Be Used with React, and Why should I Opt for FusionCharts?
So now we come back to our original question. Can Chart.js be used with React? Yes, it can be used but it won’t have all the features, capabilities, and the power of FusionCharts. FusionCharts comes with a staggering 100+ charts, graphs and gauges along with 2000+ choropleth maps. There are also awesome color schemes and themes that you can use in your charts. Additionally, the charts and graphs you create are interactive and responsive.
What’s more? You can create the perfect data visualization for your project without having much coding knowledge. Most of the functionality is already present in the React chart created with FusionCharts. You can save a lot of time by utilizing the default interactivity including panning, zooming, scaling, interactive legends, and much more.
How do I Sign Up for FusionCharts?
FusionCharts is a beautiful JavaScript library. It is 100% customizable and includes an awesome variety of charts, gauges, graphs and choropleth maps to choose from. Additionally, it runs seamlessly on all browsers running on all types of platforms including Windows, Mac OS, Linux and more. FusionCharts is even optimized to render charts and graphs on mobile devices running on different platforms including iOS and Android.
Don’t wait any more. If you are not already a FusionCharts user, then head out and download the FusionCharts trial version today!
