The saying that a picture says a thousand words is true even in the world of financial markets and stock trading. Analysts use different types of charts and graphs to understand the historical price data, as well as the fluctuations in various stock chart indicators. Stock charts are not only a great tool for understanding past and current real-time data, but are also helpful in projecting stock prices in the future. Therefore, knowing the best stock chart website/ app is essential for any investor or analyst.
We have compiled this guide to help you choose the right library for creating a JavaScript stock chart. Continue reading to discover what are stock charts and the best free stock chart websites.
Table of Contents
What Are Stock Charts?
Stock charts are a graphical representation of the current and past values of the stock price data. They can be yearly price charts, trading volume graphs, active traders’ depictions, intraday charts, weekly charts, or any other representation of various technical indicators related to the stock market. These charts may represent historical data, best charts for day trading data, or any other time period. They may even be used to illustrate trade ideas.
Essential Features for Choosing the Best Stock Chart App
Here are different aspects and features to look for in stock chart plotting software. Ask yourself the following when choosing the best stock charting software:
- Which technical indicators can the charting tool plot?
- Can you plot trend lines?
- Can the software compute moving averages and plot them?
- Are there annotation tools for annotating the stock chart?
- What are the different types of charts supported by this software?
- Which time intervals are supported? For example, can you plot year, month, week, and day trading data?
What Are The Different Types Of Stock Charts?
There are many types of best free stock charts. Some of them are discussed below:
What Is A Line Chart?
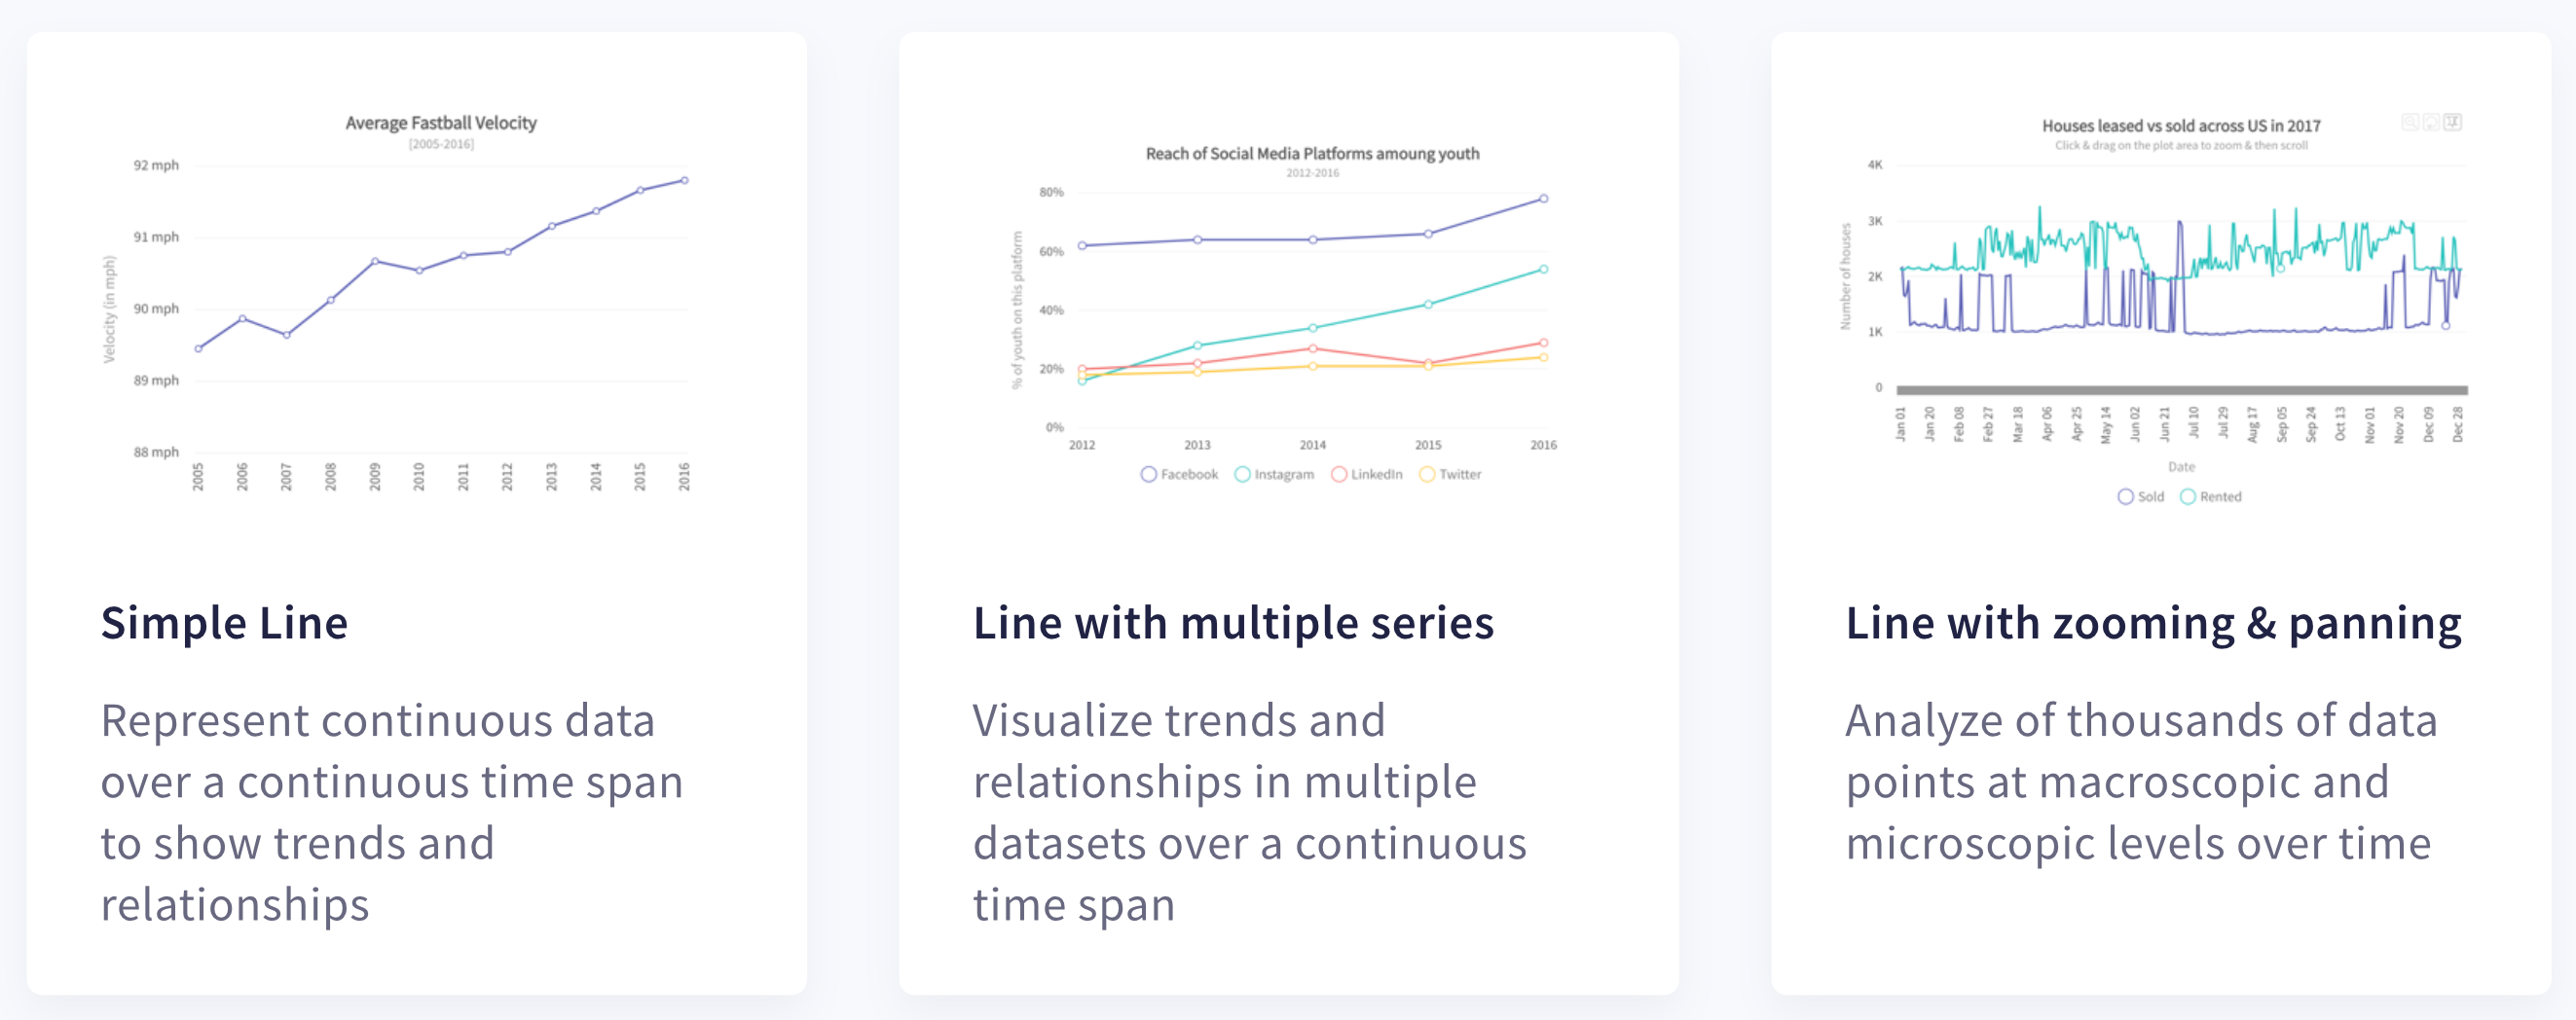
You can use a line chart to plot the most popular technical indicators over a continuous time span. The x-axis represents time, and the data points are normally connected through line segments. You can add trend lines to these free stock charts to perform a technical analysis of market data and show the underlying trend or movement of the price values. You can also plot ETF trades, stock prices, financial market data, and more.
Can I Use A Bar Chart For Technical Analysis Of Stock Market Data?
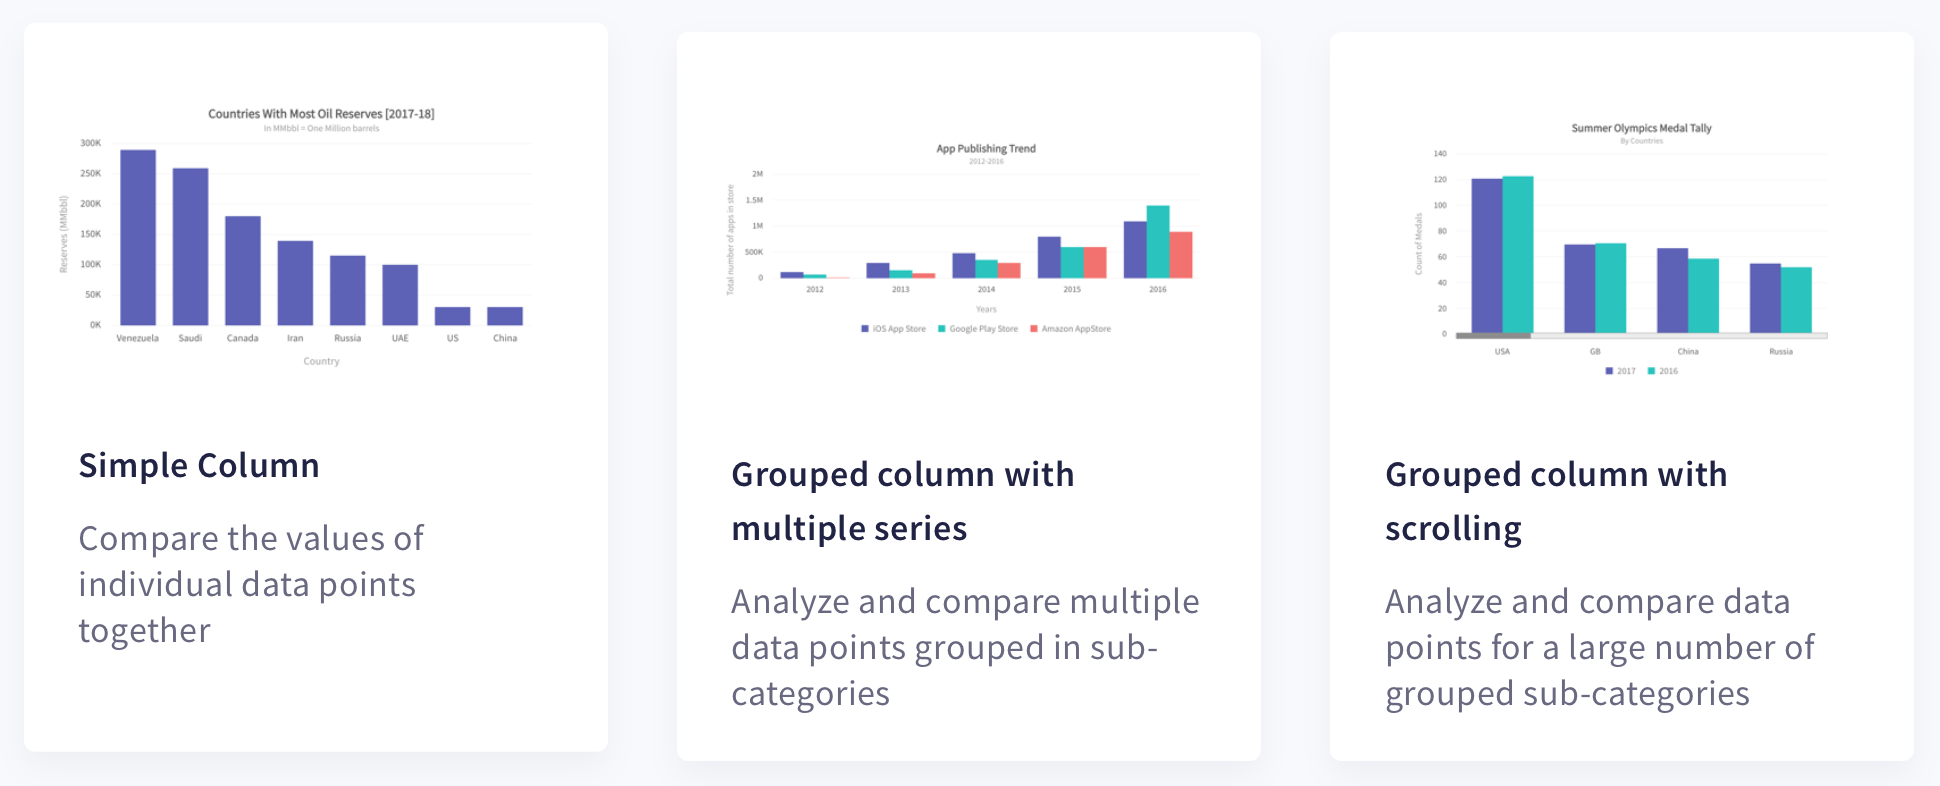
Indeed, yes! Bar charts are an effective illustration of stock market data. They represent data using horizontal bars of equal width. The length of each bar is proportional to the value it represents. You can also use them for a complete analysis and comparison of different stock prices.
What Are Candlestick Charts?
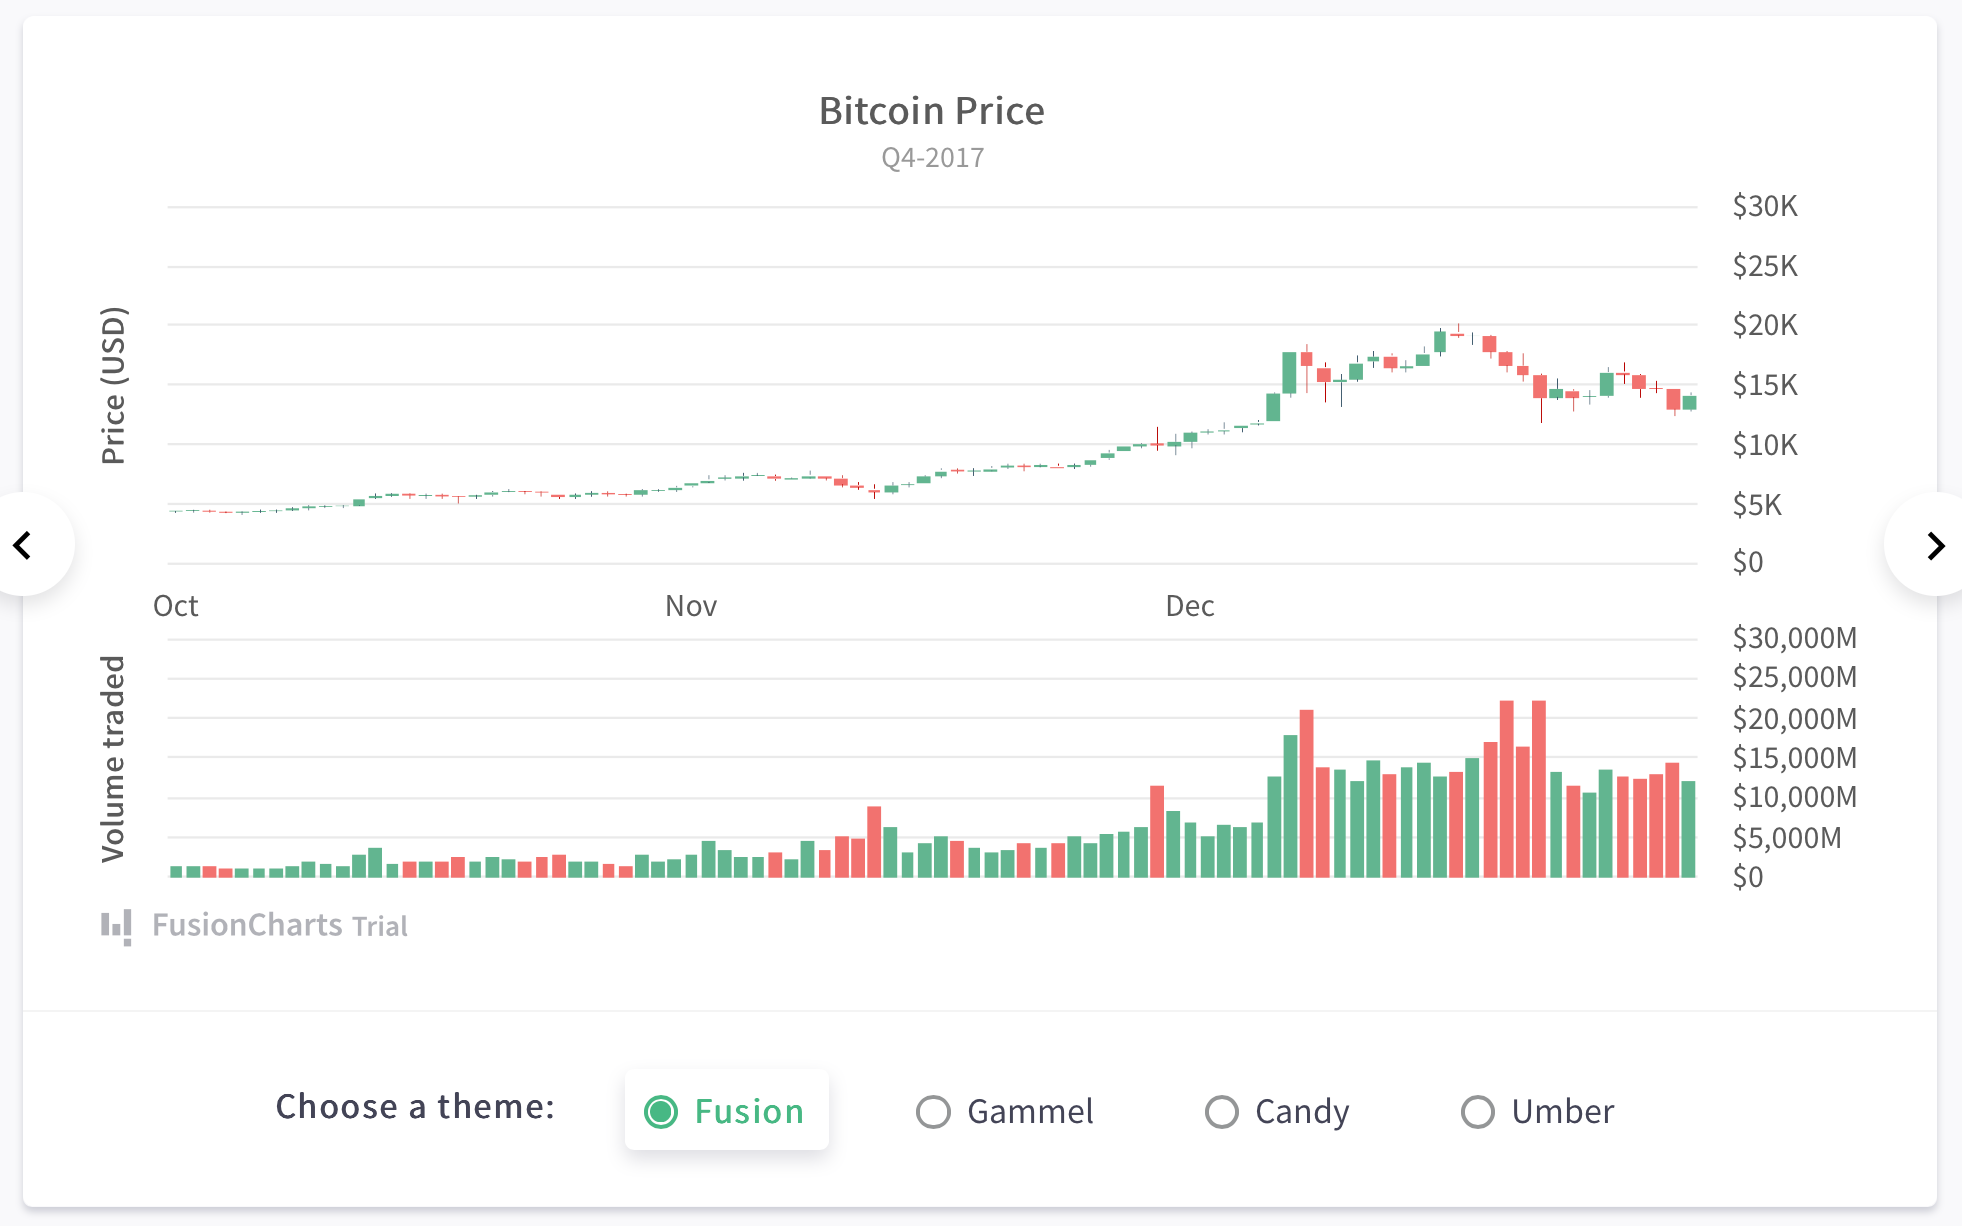
A candlestick chart is a combination of a bar chart and a line chart. It is the price chart of opening, closing, highest, and lowest values, along with the trade volume on a single chart.
What Are The Best Free Stock Charts Drawing Tools?
Now we describe the most popular charting platforms to create different types of stock charts. Some of them are free charting tools with a free version and some require a paid subscription.
Why Is FusionCharts The Best Charting Software?
You can use FusionCharts to create the best stock charts. FusionCharts includes a free version for non-commercial use, so that you can create free charts. Commercial users need an annual subscription plan.
With this best stock charting software, you have a wide variety of free interactive charts to choose from. You can even use these charts to create impressive technical analysis reports. This JavaScript library is a favorite with online brokers, advanced investors, and frequent traders alike.
What Are The Features Of FusionCharts For Creating Free Stock Charts?
Here are some features of FusionCharts:
- FusionCharts ships with 100+ charts, graphs, and gauges, along with 2000+ choropleth maps, to help you create all types of data illustrations – from simple to advanced charts.
- Depict your money trading stocks with advanced charting tools that let you illustrate real-time data through data streaming charts.
- Integrate FusionCharts the best stockcharts free tool in any app or software of your choice. It is the best tool for creating browser-based charts.
- You can draw trend lines, show moving averages, highlight important technical indicators, and more with FusionCharts.
- FusionCharts Graphs, plots and charts are highly interactive and responsive.
- You can create the best stock chart with FusionCharts and customize it 100%.
What Is StockCharts?
StockCharts is a technical analysis platform with various options to create different types of stock charts.
What Are The Features Of StockCharts?
Here are some features of StockCharts that prove it the best stock chart app:
- Advanced winning stock charting.
- Real-time intraday charts for advanced charting.
- More technical indicators and overlays.
- Expert market commentary from industry experts.
- You can organize charts with ChartLists.
- Advanced technical scanning to search for stocks that meet a certain criterion.
- Create configurable alerts based on the technical indicators.
What Is Yahoo Finance – A Stock Chart Website?
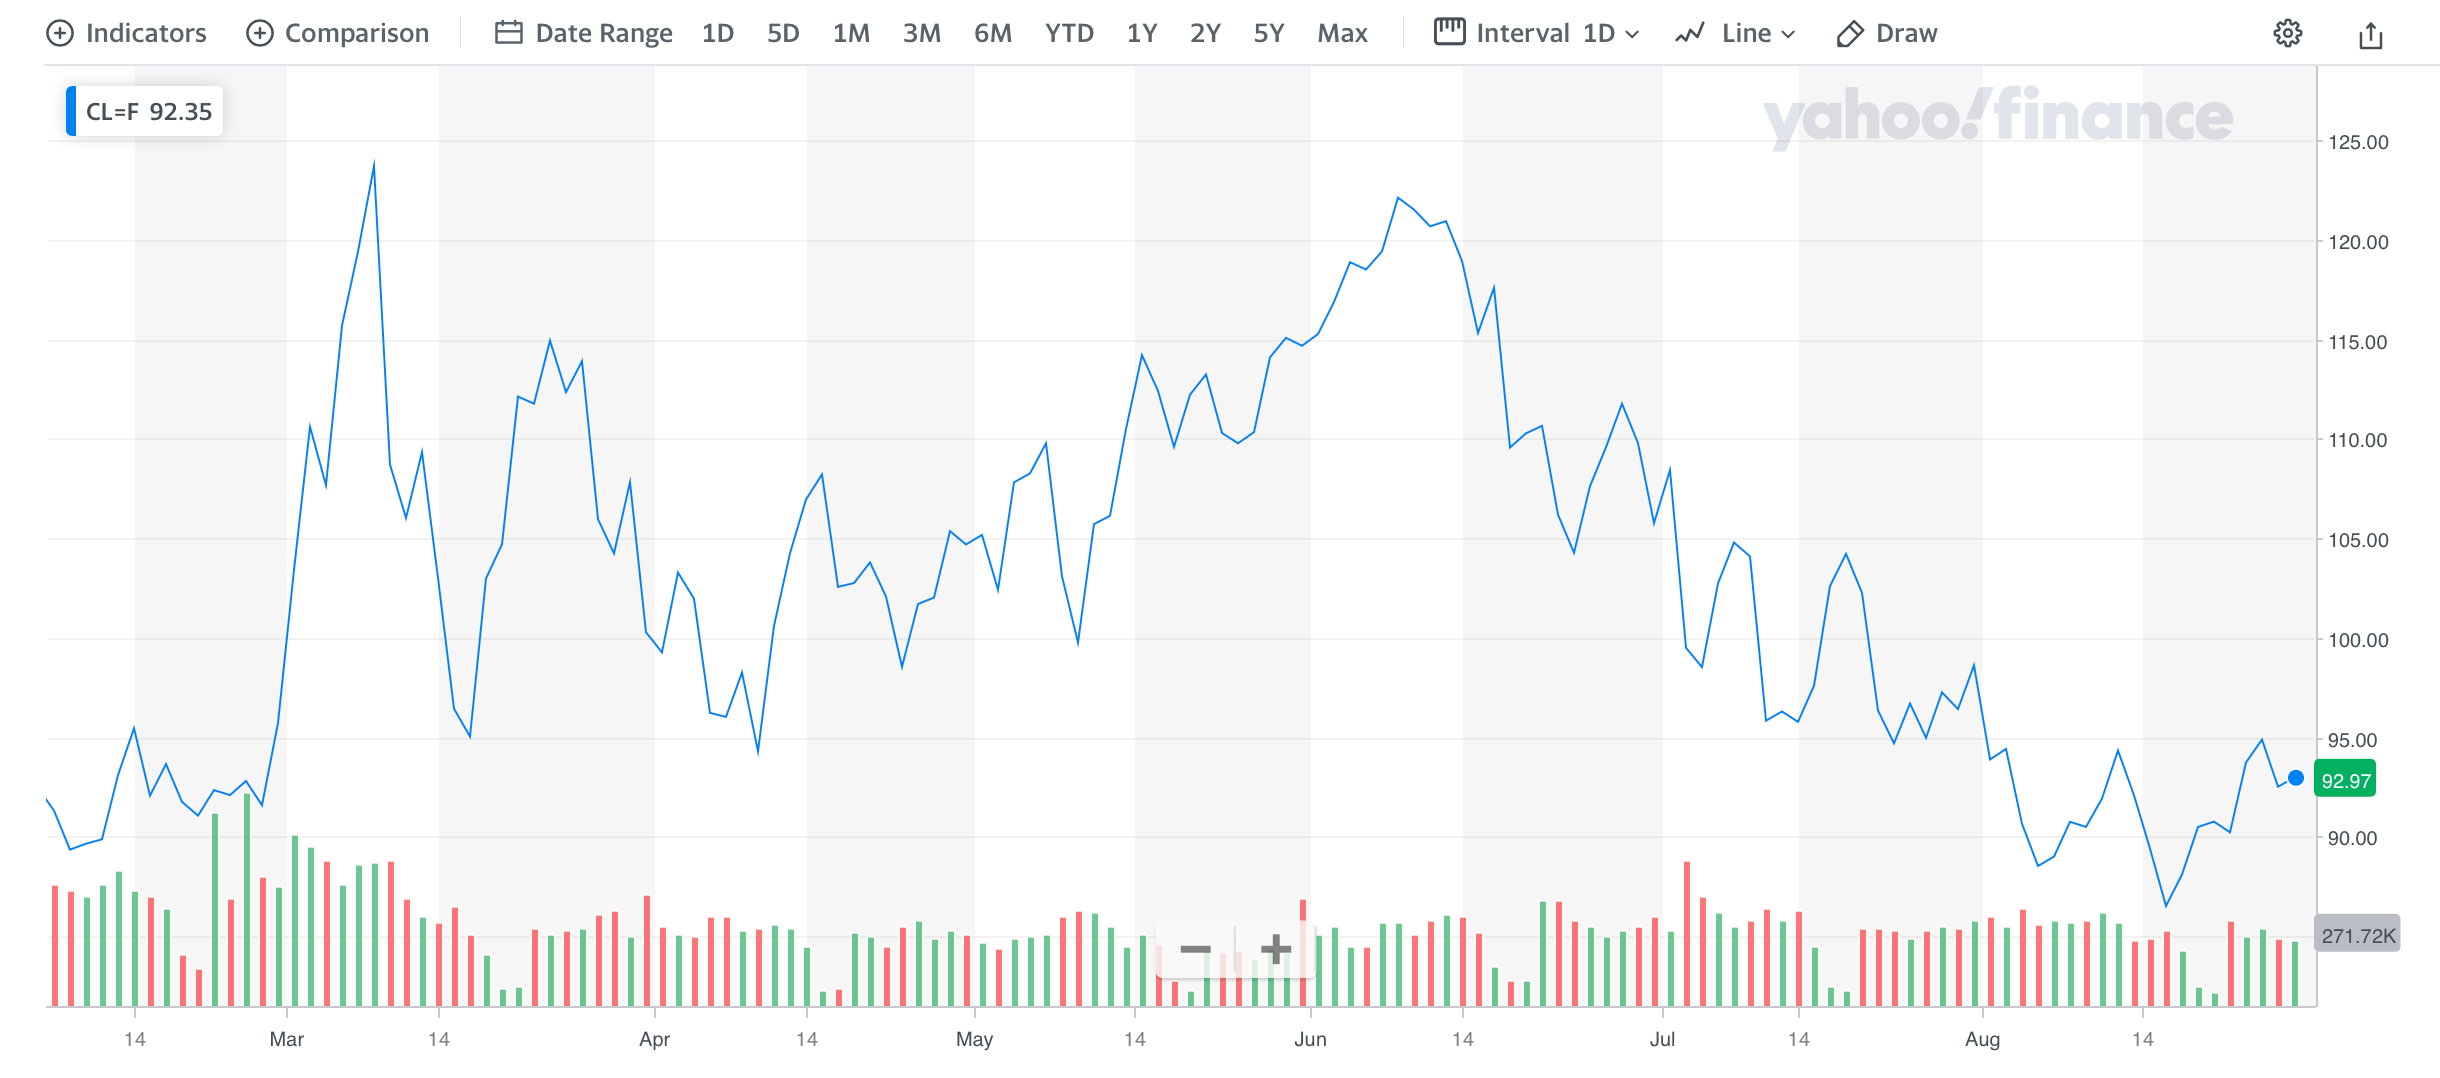
Yahoo Finance is also one of the stockcharts free charting platforms. You can access data from a trading platform, view it as a spreadsheet, or plot the data. For example, you can view the New York stock exchange data, search and filter stocks, and plot its various technical indicators.
What Are The Features Of Yahoo Finance?
Here are some features of Yahoo Finance:
- Add different types of indicators, for example, extract and plot 50 or 200-day moving average.
- Plot data for different time intervals.
- View open, low, high, and close values.
- Option to change settings and view percentage.
What Are Finviz Charts?
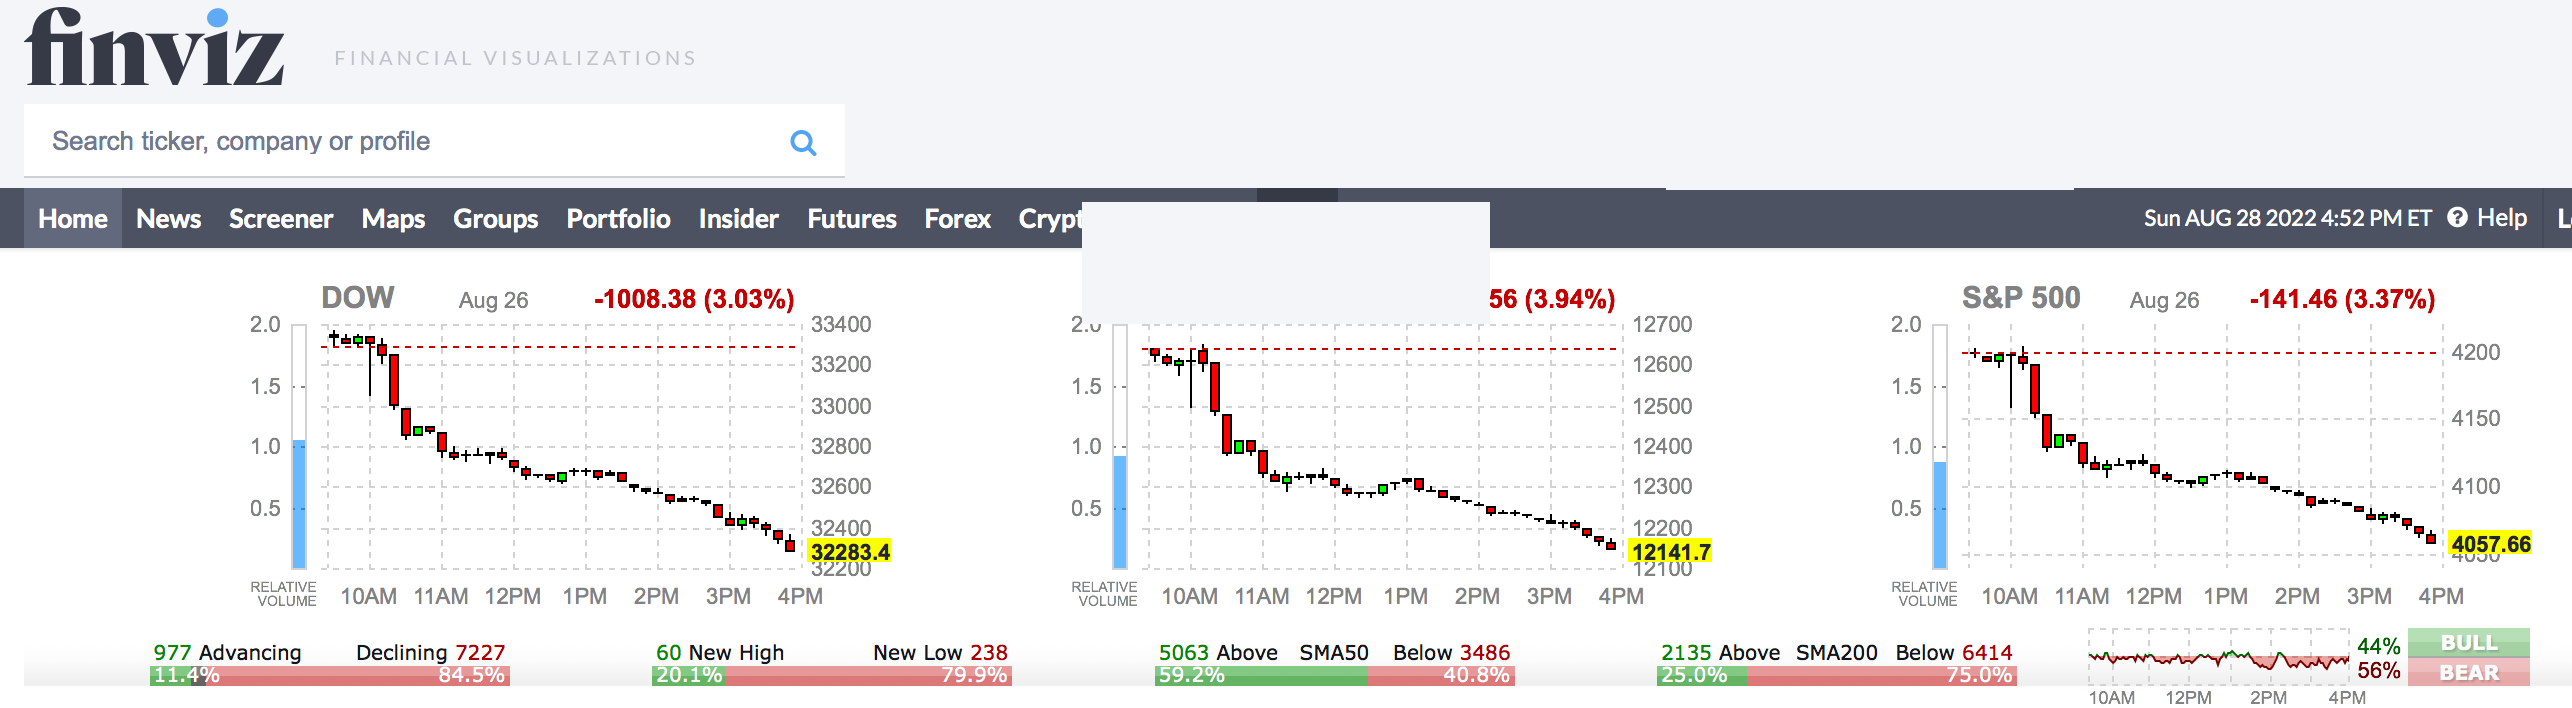
Finviz is also one of the best stock charting software. A Finviz chart helps you visualize different types of trading and stock data.
What Are The Features Of Finviz
A few noteworthy details of Finviz, a stock screener platform, are given below:
- Extract data from a trading platform and plot it.
- View charts depicting daily, weekly, and monthly data.
- Option of selecting different types of technical indicators.
What Are TradingView Charts?

TradingView is another tool for stockcharts, free charting and plotting trading data. It has great options for investors, analysts, and brokers who trade stocks.
What are the Features of TradingView?
Here are some features of TradingView:
- You can include different stocks and indices in your watch list. Once you select one of them, you can easily plot them.
- Easily scroll through different portions of the stock chart.
- Annotate the plots using different objects and shapes.
- Get long-term and short-term views.
What Are Stock Rover Charts?
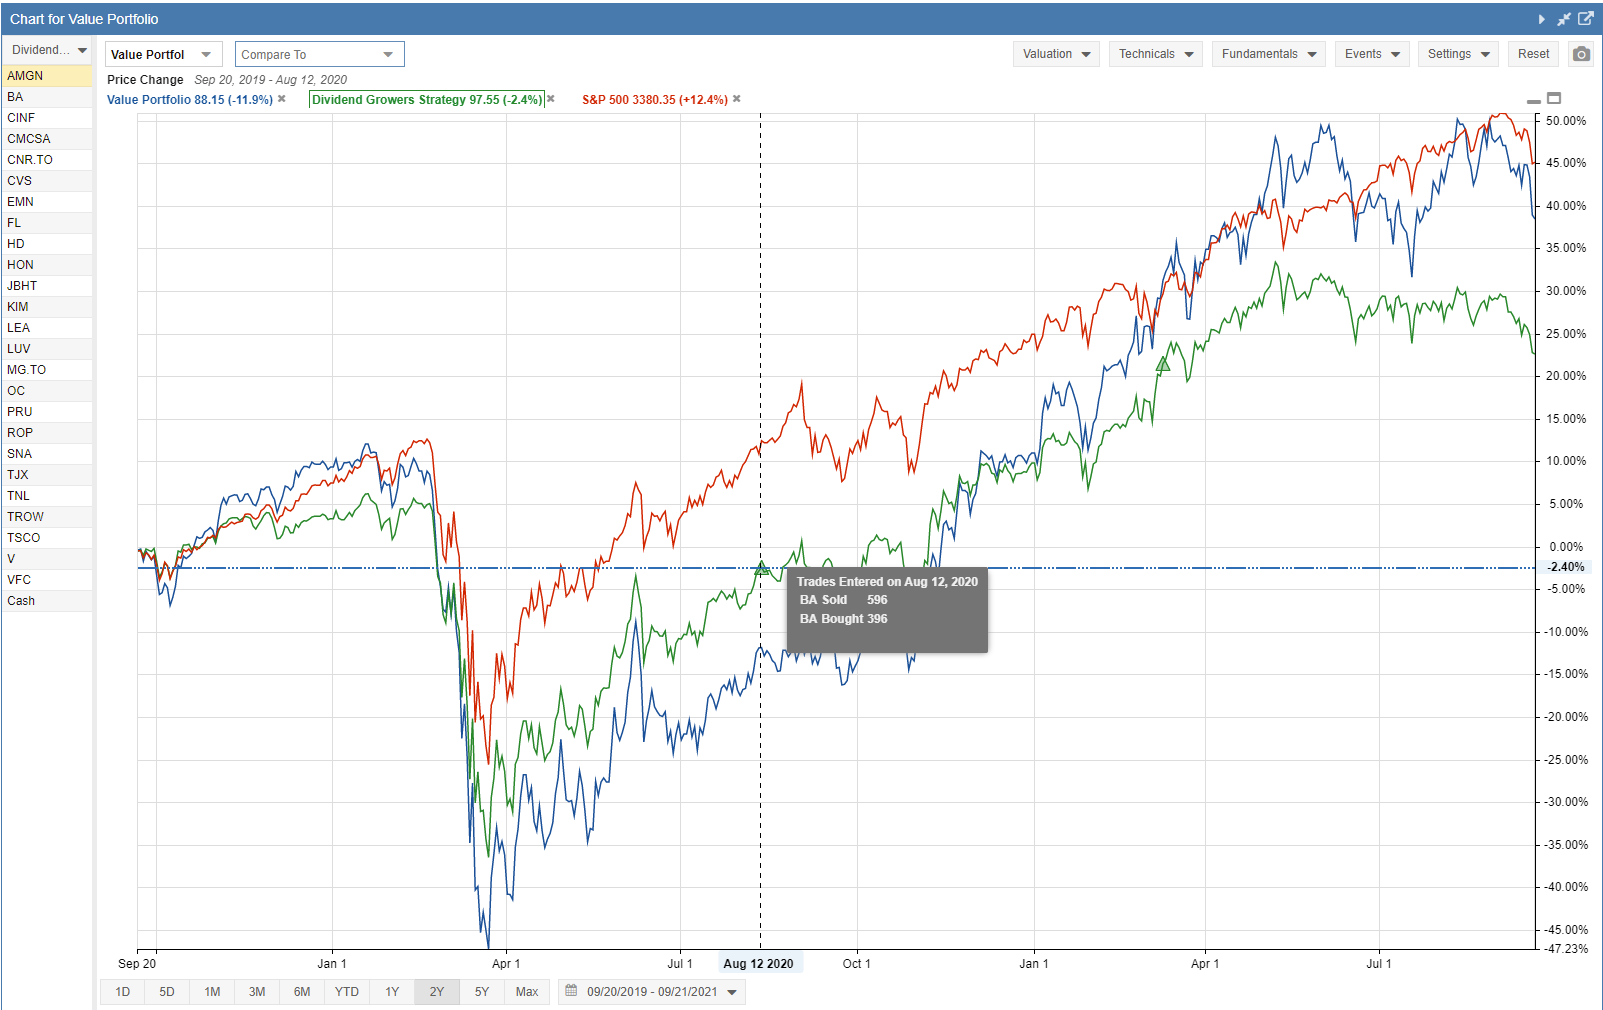
Stock Rover charts are a powerful tool for investors and traders to visualize and analyze stock market data. They serve as a valuable platform to analyze and understand the complex dynamics of the stock market.
What are the Features of Stock Rover Charts?
Let’s look at some of Stock Rover’s features, one of the best stock charting software:
- You can make informed comparisons by easily comparing investment options side-by-side in a flexible spreadsheet.
- Find your perfect picks by filtering through stocks and ETFs based on your unique criteria using powerful screeners.
- Track your progress like a pro by analyzing the performance of your portfolios with in-depth metrics, whether one or many.
- Become an investment expert by gaining deeper insights into your equities with comprehensive research reports and insightful analysis.
What Are TrendSpider Charts?

TrendSpider is a technical analysis tool that automates routine processes. It uses patented algorithms and a complex mathematical approach. Expert testing has confirmed that TrendSpider effectively identifies trend lines and patterns.
What are the Features of TrendSpider Charts?
Here are several amazing features that list TrendSpier as the best free stock analysis website:
- Automatically identifies and draws precise trend lines, improving chart analysis efficiency.
- TrendSpider’s automatic heatmaps quickly identify asset strengths, aiding detailed predictions with trend lines and Fibonacci levels.
- TrendSpider effectively identifies multiple candle patterns on charts, providing valuable insights for traders of different levels.
- TrendSpider’s MTFA feature lets traders view two-time frames on one chart for easier analysis, helping day traders make more informed decisions.
What Are Benzinga Pro Charts?
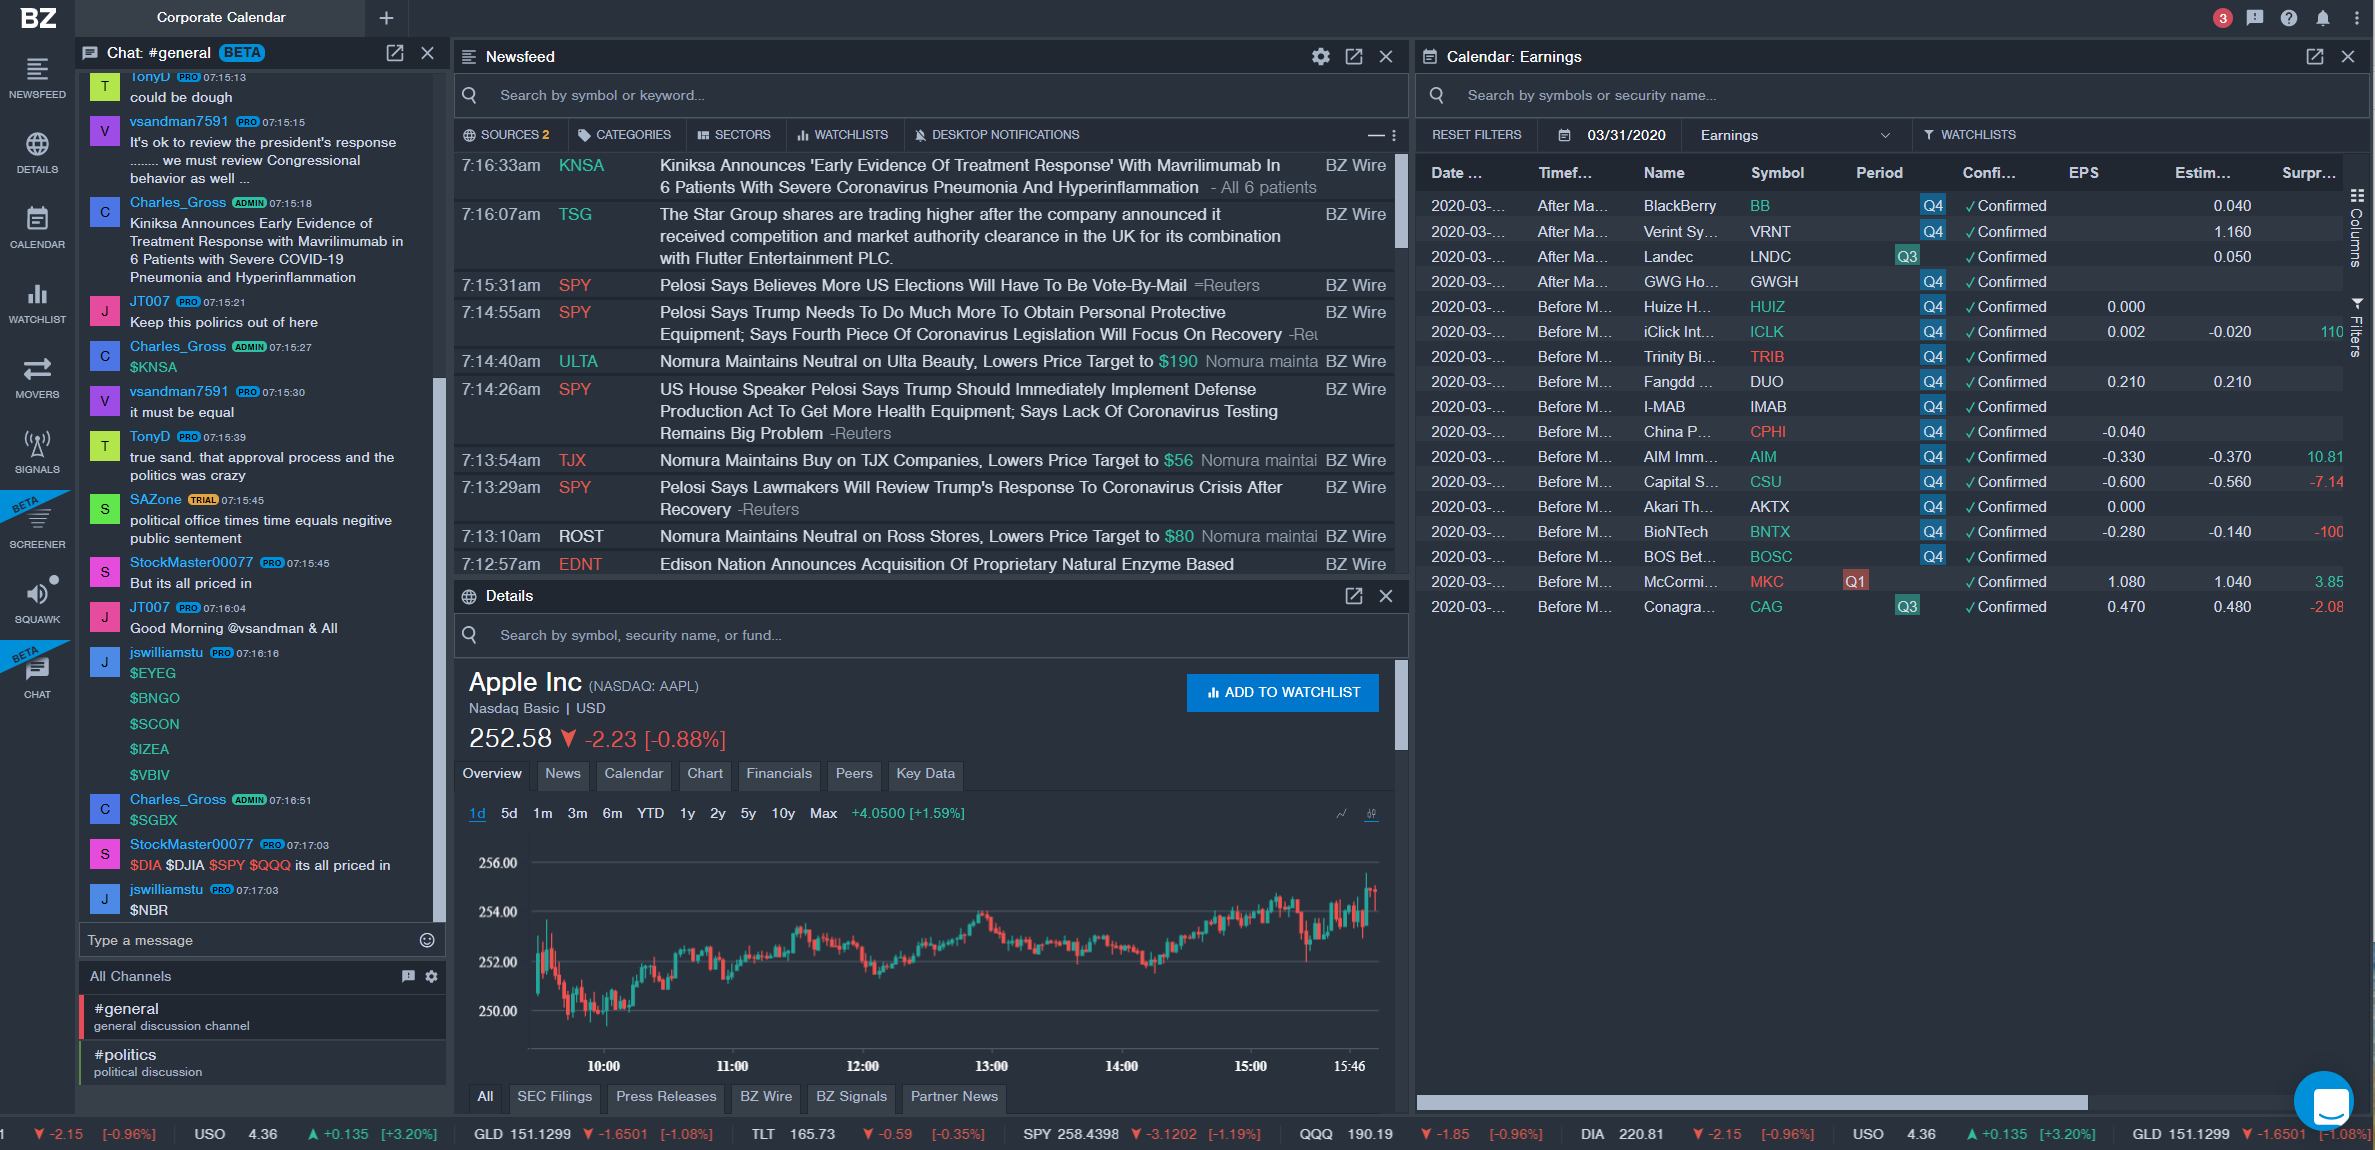
Benzinga Pro Charts are technical analysis tools built into the Benzinga Pro platform for active traders. This best stock charting software offers real-time data, various technical indicators, and news integration from Benzinga’s feed, all within a single platform.
What are the Features of Benzinga Pro Charts?
The four amazing features of Benzinga Pro charts are mentioned below:
- Users can filter market movers with customizable criteria and visualize data for easy analysis.
- You can customize the BZWire news feed to track sentiment and impact indicators.
- Access interactive company financials for peer comparison and integrated news updates.
- Utilize advanced stock charting tools with customizable layouts and collaboration features.
Conclusion
In conclusion, choosing the best stock chart website or software is crucial for investors and analysts alike. Stock charts provide a visual representation of historical and real-time stock price data, aiding in technical analysis and decision-making. FusionCharts emerges as a top choice for creating stock charts, offering a wide range of interactive and customizable charts.
With its user-friendly interface and advanced features, FusionCharts is a preferred tool among online brokers, advanced investors, and frequent traders. So, upgrade your data visualization with FusionCharts and make informed investment decisions.
Best Stock Chart Website: What Are The Key Takeaways?
Stock charts are an effective means for visualizing, interpreting, and plotting different types of financial and trading data. An off-the-shelf solution such as FusionCharts offers the best means for plotting and visualizing data. It is trusted by over 800,000 developers across 28,000 companies.
Take your data visualization experience to a whole new level. Sign up and download the FusionCharts package today!
FAQs
👉 What is the best chart for the stock market?
The best chart for the stock market depends on your specific needs. However, popular options include candlesticks, lines, and bar charts. Candlestick charts are often preferred for their visual representation of price movements.
👉 What is the best website to Analyze stock charts?
Several websites offer the analysis of the best free stock charts. Some popular options include FusionCharts, StockCharts.com, and Yahoo Finance. Each platform provides unique features and tools for analyzing stock charts, so it’s worth exploring them to find the best fit for your needs.
👉 What are the key features to look for in a stock chart website?
When choosing the best stock chart app/website, look for features such as real-time data, customizable charts, technical indicators, drawing tools, and the ability to save and share charts. Additionally, consider the platform’s ease of use and mobile compatibility.
👉 How can I use stock charts to make informed investment decisions?
Stock charts can help you analyze historical price trends, identify patterns, & predict future price movements. Using technical analysis tools and studying chart patterns, you can make informed choices about buying, selling, or holding stocks.
👉 Are there any free stock chart websites that offer comprehensive analysis tools?
Several of the best free stock chart websites offer comprehensive analysis tools. Some popular options include FusionCharts, which offers charting capabilities & a wide range of technical analysis tools, and StockCharts.com, which provides advanced charting features and customization options. Yahoo Finance also offers free stock charts with basic analysis tools.
