
Knowing how to chart stocks can play an important role in trading success. It can help us make big trading decisions. Tools like react Gantt chart can be very helpful to visualize price patterns. When we plan to invest in trade stocks, we must learn how to chart stocks and how to read them. We can easily find stock charts on Google and Yahoo.
It is a common fact that stock charts appear complex, especially for new investors. But we can make attractive decisions once we know how to read stock charts. It can also help us chart stocks using a graph maker, such as react Gantt chart tools. This article is a complete beginner’s guide to charting stocks and how to read them in stock market investing.
Let’s dig into it.
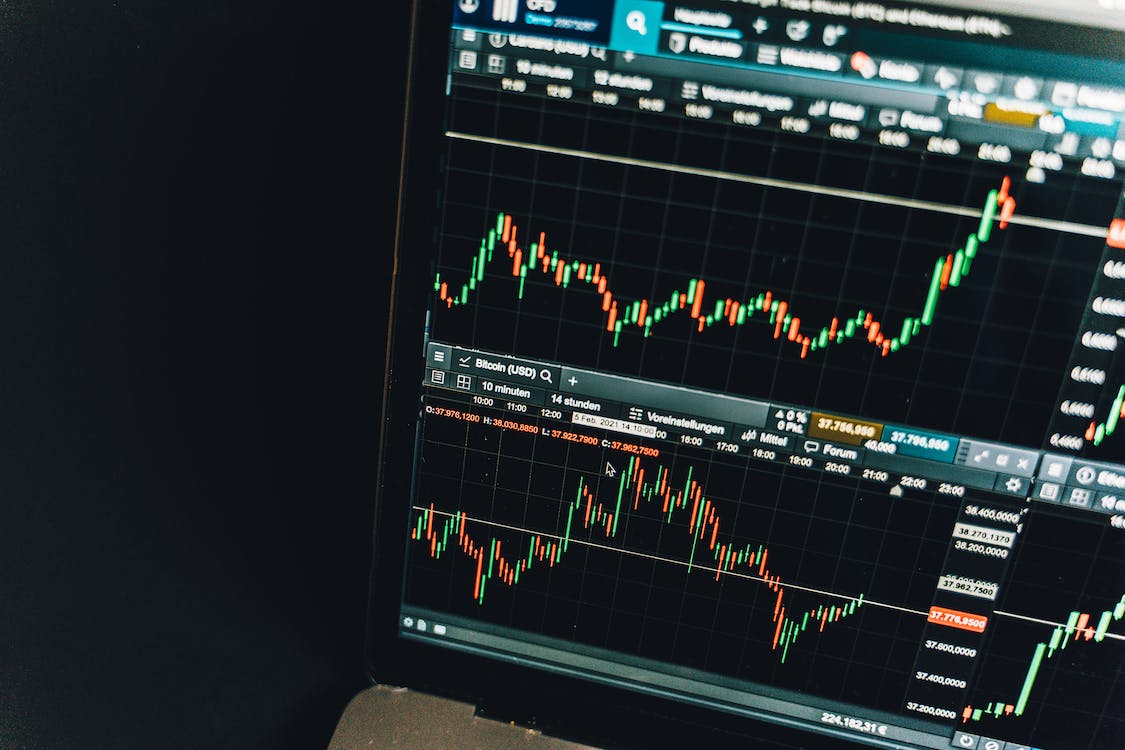
Table of Contents
Why Should You Use Stock Charts?
First, it is very important to be clear about this thing. Different professionals keep different instruments with them to get the job done.
For example, surgeons keep scalpels, carpenters keep hammers, and in the same way, traders use stock charts.
As traders, we should not overlook the stock chart. These charts are basic, but highly powerful, tools.
Using these charts, we can understand stock price action and make better-informed and intelligent trades. Some important things that we can understand using stock charts are:
- Price momentum
- Stock’s price trend
- Where to locate a stop-loss to prevent the risk
- Support and resistance levels
We can base our trading decisions on the following stock charts. Therefore, we should know how to read them.
What’s On A Stock Chart?
Stock chart components are broken down into the following parts:
Price Movement
Price is the most important thing that traders find on every chart. There are two axes on the stock chart. The x-axis represents the time, while the y-axis represents the price.
We can see the price plotted at points on a line chart. These points represent the traded stock.
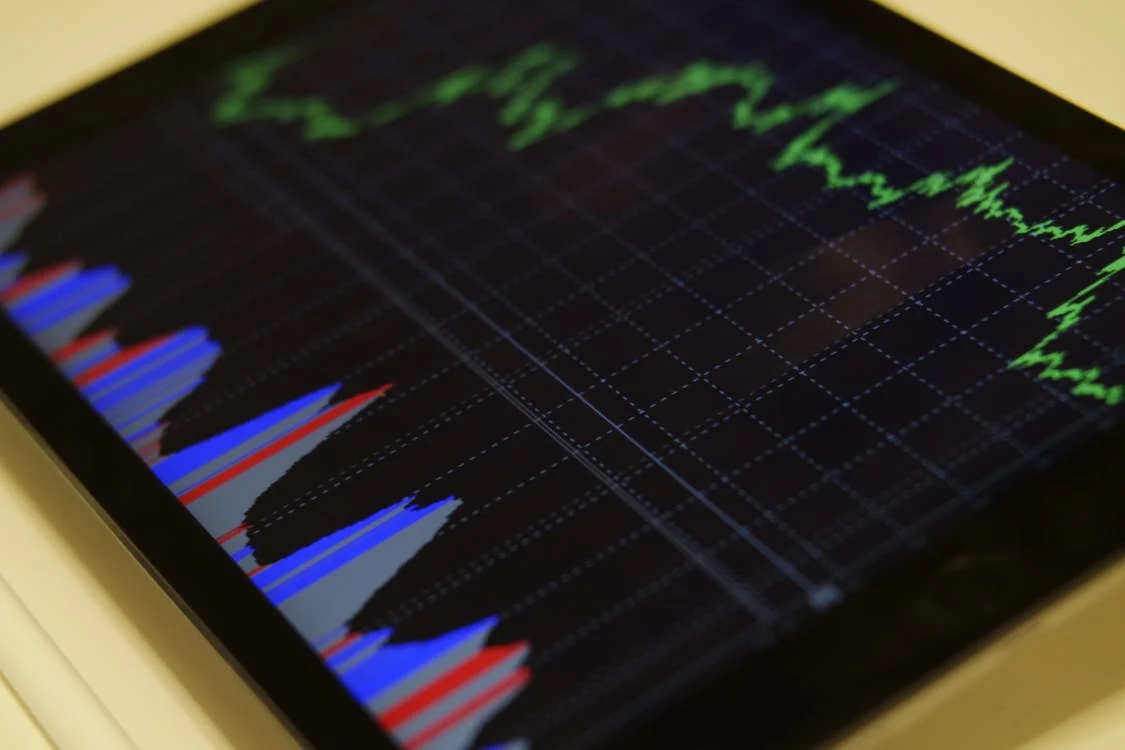
Trading Volume
Trading volume tells you about the amount of stock traded at a particular period and price. It helps to know the price levels that may excite traders to exit or enter the trades.

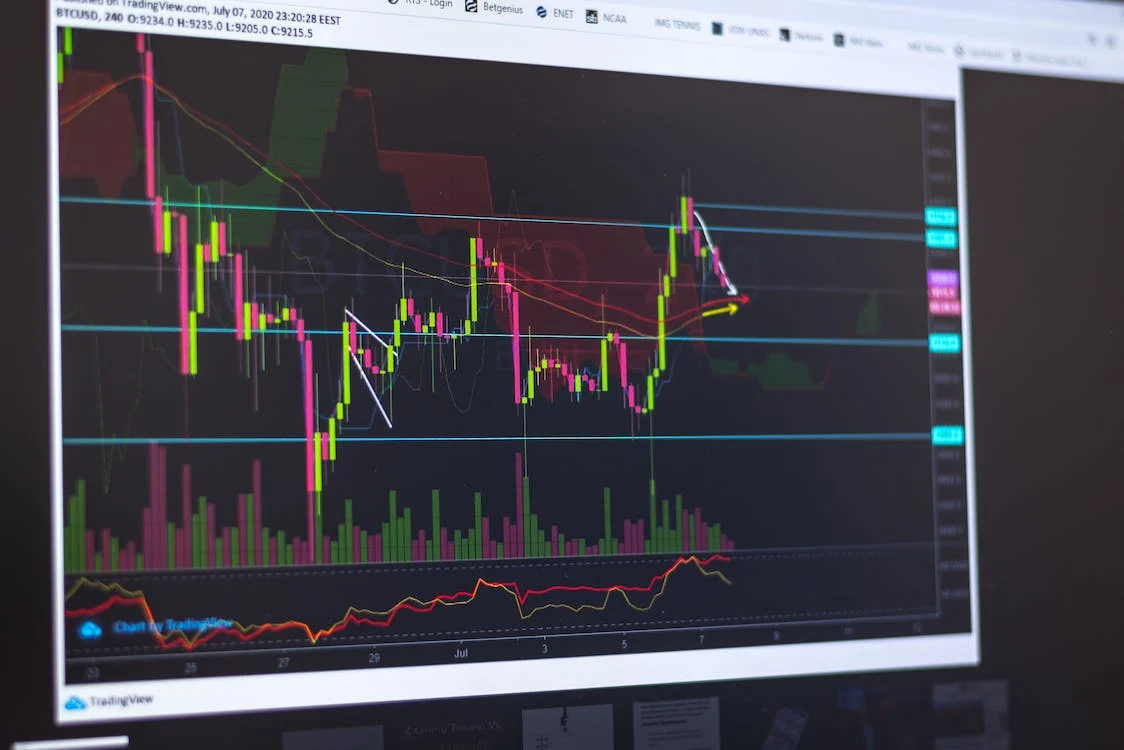
Technical Indicators
There are several technical indicators on a stock chart. Technical indicators allow us to know price trends and momentum on a stock chart.
The volume-weighted average price indicator is the most popular technical indicator.
VWAP Indicator
According to experts, day traders like this type of trader. It is volume weighted average price indicator. It is lined on the chart, looking like moving averages.
However, the VWAP line shows the price at which most stock trading activity occurred.

How Can You Read Stock Charts As A Beginner?
In simple words, the stock chart represents the graph of the stock price moving averages, as well as trading activity volume. The patterns can vary in different charts, such as figure charts.
We can see patterns using charts. It can help us figure out the next move in stock price using a point and figure chart.
We can find tons of charts available online, but let’s narrow down our options by focusing on some charts outlined below.
Line Chart
It is the most basic view of our stock price movement. We can see the price plotted at certain points. We can also see these points connecting to form a line.
The line trends depend on the action of price. But traders don’t use these charts.

Bar Chart
These charts show the closing prices, highest and lowest prices, and available prices using the bar charts.
The top of the bar shows the highest price, while the bottom area shows the lowest prices. The left vertical line shows the open, while the right vertical line represents the close.
Candlestick Chart
These charts are considered similar to bar charts, but act differently. Since these charts are rich in information, lots of traders love these charts.
We can see the difference between an open and closed through the body of the candle.
Since the shape looks like candle sticks, it is called a candlestick chart. Traders should also know how to read a candle chart.

What Are Daily And Weekly Stock Charts?
We can see day traders using the daily stock charts. However, strange patterns can emerge in these charts. On the other hand, no such patterns can be seen in the weekly chart.
It can help us better key in on the trend and setup.
However, we can find useful information in both charts. Such as:
- How did our stock close yesterday?
- What happened after a poor close of stock, and vice versa?
The closing price gives an idea about the last price at which our stock trades.

What Are Common Chart Patterns For Traders?
We can learn a lot of patterns while trying to figure out how to read these chart stocks. However, the six most common patterns are listed below:
Triangles
Triangles are present in ascending and descending forms on the stocks chart. These are very useful and pretty easy to learn.
A stock is gearing towards the run if the top line is horizontal. In that case, the bottom line is ascending. The stock could tumble if the situation is the opposite.
The symmetrical triangle could go in either direction.
Head and Shoulders Pattern
We can analyze the trend reversal pattern using the head and shoulders patterns. When the price rises to one level, it forms the first shoulder.
It then decreases and rises to another level to form the head. Then it will decline again, comes along with the first shoulder, and decline again.
A neckline is formed through the stocks. There also exists an inverse head and shoulders.

Cup and Handle
This pattern is more useful for patient traders. A U shape is formed when a stock is fallen after being rejected.
It slowly rises and meets the level of resistance again. It will keep working like that.
Wedge
The wedge pattern is more like a triangle pattern. However, the trend lines often suggest a reversal. Volume can lose steam while it fizzles on the way up, giving in to the sellers.
It can also happen in another way. The stock also becomes oversold, and it can start churning upward.

Gaps
We often hear traders talking about stocks gapping up. It is an interesting part of our stocks due to earning reports or news.
The gapping refers to the literal gap that exists between two price points. Gapping occurs when the opening price becomes the lowest or highest.
However, these trends cannot reverse quickly.
Basic Volume Patterns
When we are trying to determine the next move of stocks, price action and average volume both matter. These stocks sell signals we can find by knowing volume interpretation.
There are two aspects to it:
Trend Confirmation
When the volume moves in a single direction and is higher, it will continue the trend.
Trend Weakness
When the stock moves in a certain direction while volume is low, that will not hold up the trend.
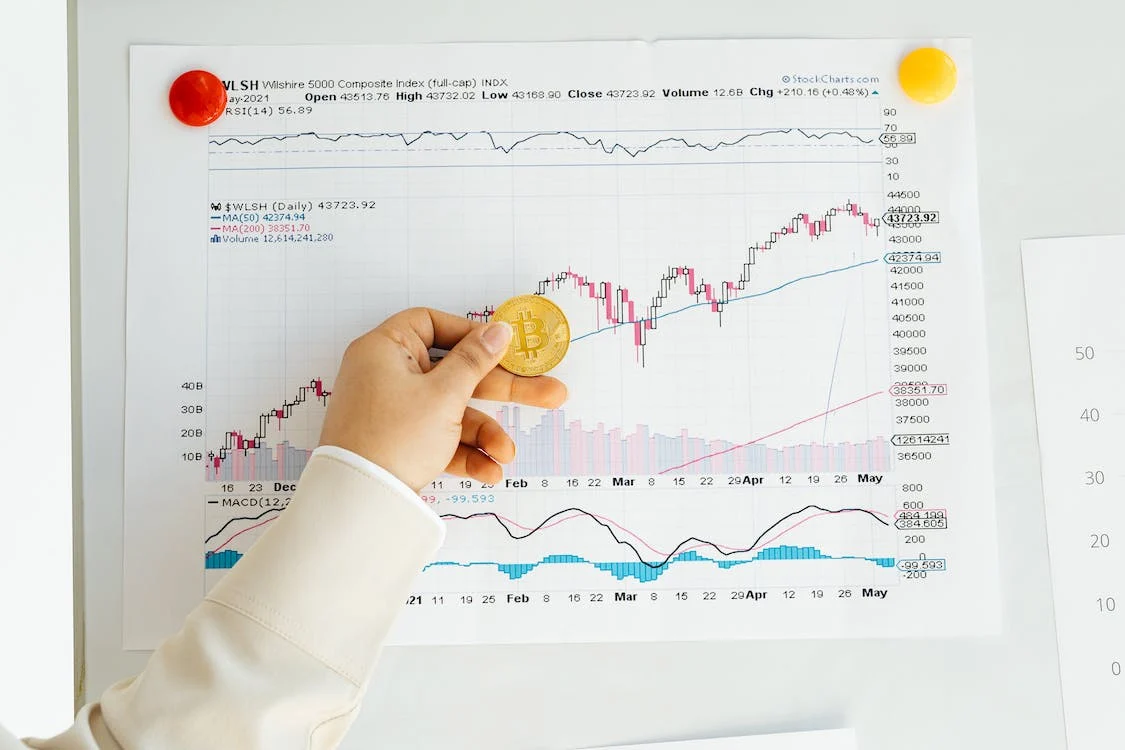
What Are Common Technical Indicators On Stock Charts?
We need to learn about a few technical indicators when reading stock charts. These are listed below:
- OBV (On-balance volume)
- ADX (Average directional index)
- Relative Strength Index
- Moving Averages
- Bollinger Bands

How To Identify Support And Resistance Levels On Stock Charts?
Support and resistance levels can help us understand future price movements or stock actions. There will be support for stock at a price that doesn’t fall below.
It has established support when a stock consistently jumps higher and hits a stock point.
To establish new support, it will go lower if the original level is not holding up. Interestingly, these support levels can also appear to be resistance levels.
It happens when a stock struggles to break a certain price point and pushes higher.
Can You Identify Trends On A Stock Chart? If Yes, How?
Yes. We can identify trends on a stock chart using technical analysis through the technical indicators explained above.
These trends are legit and highly useful, so a trader should learn them. However, there are no guarantees for these trends. These trends can go against our expectations.
We can find several best free stock charts online and learn the stock chart patterns.
FAQs
What type of graph is best for stocks?
Candlestick charts are the most common type used across the trading world. In simple words, these are a standard used on any platform.
Does charting work for stocks?
We can calculate monetary values using the charts. It can help us figure out trade failure and price levels. Charts can help us make an accurate decision for stocks.
How Do You Pick a Stock Based on a Stock Chart?
We should use reliable methods for the identification of trends and stock prices. We can take action once we establish whether a stock is bearish or bullish.
What Are the Best Stocks to Buy for Beginners?
Beginners should choose the stocks that work best for them in analyzing average daily volume. There is no size that goes well with all kinds of trading in stock analysis.

Download and start your free trial today to get responsive and interactive charts for all projects.