We must know how financial metrics play a good role in business performance. Any business that is ruing without facial metrics is more likely to gain insights with the least performance. However, implementing the financial dashboard in a business’s application can improve it. An accounting dashboard can prevent the chances of risks of insufficient funds.
A financial dashboard can help us to get a broader view of our business’s financial conditions. We get an idea of how much someone pays, who pays, for what product, and in what form. Keeping a manual record of all these financial metrics can also mess up everything. Let’s check the role of financial dashboards and their examples for our business.

Table of Contents
What Is An Accounting Dashboard?
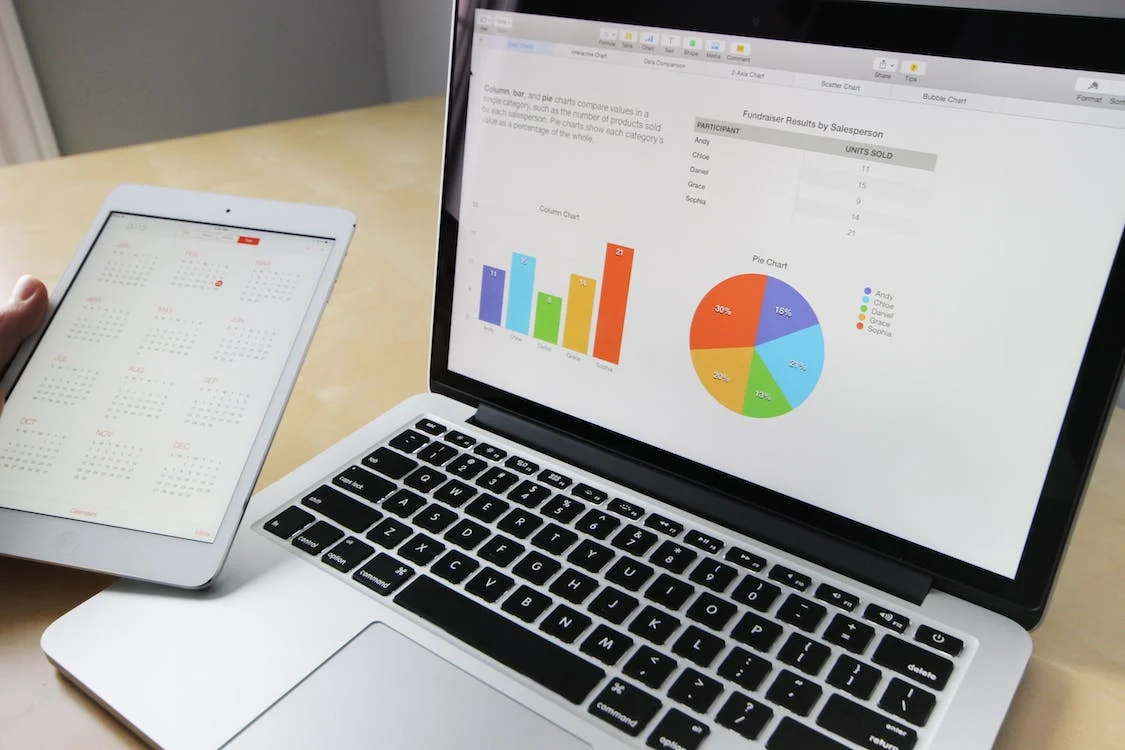
An accounting dashboard helps us to visualize the financial data from multiple resources. Moreover, the view of invoices is displayed in real-time. It displays all the financial reports and metrics in one place. Moreover, we get insights into profit and loss, accounts payable and accounts receivable, cashflows, and invoices.
What Are The Key Features Of FusionChart Accounting Dashboard?
FusionCharts is the fastest JavaScript library to build dashboards, charts, and maps for our business. Using accounting dashboards can use as a business intelligence tool to maximize business productivity. Here are some amazing features of FusionCharts accounting dashboards.
Customizable
A wide range of themes and colors is available on the FusionCharts website. Therefore, we can create a customized accounting dashboard that can follow our business’s theme.
Interactive
The best feature of FusionCharts dashboards is that they are highly interactive. We can easily explore the data sets, visualize their details, and drill further into our data.
Data Import
In other dashboards, we might need to import data manually, which will take a lot of time. However, FusionCharts help us directly import our data in the form of SQL, Excel, and CSV databases.
Real-Time Updates Of An Accounting Dashboard
FusionCharts data charts can help users visualize the current data through its real-time updates. Hence, it creates a highly interactive and informative accounting dashboard.
Multiple Chart Types
FusionCharts gives us the ability to choose from more than 100 chart types. We implement those charts into our dashboards. Some examples are pie charts, bar charts, and line charts.
Mobile-Responsive
FusinCharts can be accessed on users’ mobiles easily. FusionCharts accounting dashboards’ mobile-responsive feature helps users interact on any device.
Integration
The biggest advantage of FusionCharts is that we don’t need to put much effort into its integration. The reason is that we can easily integrate it with other platforms and tools. Some examples are business intelligence tools and CRM systems. Moreover, there are different frameworks of integration, such as Java, Vue, PHP, and Angular.

Let’s explore some amazing tips on setting up an accurate accounting dashboard for our application.
What Are The Tips On How To Set Up An Accounting Dashboard?
Setting an accounting dashboard is not rocket science, especially when we are using FusionCharts. However, there are some tips that we must follow to get amazing results. Here is a list of the six best tips to get the best financial dashboard. Let’s dig into them.
Determine Your Goals Before Creating an Accounting Dashboard
Before we implement an accounting dashboard, it is important that we must know our final output. We must figure out if we want to keep a record of specific financial metrics. We should also know if we want to identify patterns or trends. It will help us to set and organize our financial data clearly.
Identify Key Metrics
The next step is identifying the key metrics we want to track using our dashboard. Some most common examples of key metrics are debt, cash flow, profit, expenses, and revenue.
Choose a Dashboard Tool
Nowadays, so many tools are available in the market with amazing features. We must choose a tool to build a financial dashboard according to our business requirements. It is important to note that FusionCharts gives you multiple customization options. A lot of business leaders also rely on FusionCharts.
Organize Your Data Using an Accounting Dashboard
Once we choose our desired tool, we must look for ways to organize our data. The final output of our dashboard hugely depends on data organization. We can use different tables, graphs, and charts to display different data types. Drill-down and filters can help us to explore data with details.
Customize The Layout Of Your Accounting Dashboard
We must know that different tools can help us customize the layout of our dashboards. The customization of dashboards includes the placement and size of graphs and charts. We have to customize the layout based on our requirements and our users’ needs.
Test And Refine
It is important that we test our dashboards before their final implementation into our application. It can help us refine the dashboard and make necessary adjustments accordingly. The best way to do it is to get feedback from the users.

Let’s dig into some amazing benefits of an accounting dashboard for our businesses.
How Can Accounting Dashboards Benefit a Business?
There are multiple ways in which we can benefit from accounting dashboards. Some most common benefits of dashboard creation are listed below:
Improved Efficiency
We can easily streamline financial processes through the help of accounting dashboards. This is possible by providing a centralized location for all our financial data. It will consume less time and eliminate the need for manual data entry.
Enhanced Visibility
We can easily perform an analysis of our financial data and access it from different devices. Hence, we get a clear and concise view of our business performance. Moreover, we can identify the key metrics in a timely manner.
Better Decision-Making Through an Accounting Dashboard
The real-time data view through an accounting dashboard can help in better decision-making. Moreover, our decisions can be more informed. As a result, we identify amazing opportunities for business growth and optimize our resources.

What Are Accounting Dashboard Examples In Relation To FusionCharts?
Here is a list of financial dashboard examples created with FusionCharts. It can help us analyze their importance for our businesses.
Tracking Financial Performance Through an Accounting Dashboard
It can help us o track and record different financial metrics. Different charts and graphs help us to identify key patterns and trends. As a result, businesses can make informed decisions.
Monitoring Budget
We can track our expenses and compare them to budgeting amounts using FusionCharts accounting dashboards. It can help us to manage the budget according to our expenses.
Identifying Cost Savings
We can identify cost-saving opportunities using FusionCharts and track areas we can reduce costs. For example, we can compare the costs of different suppliers and find the most cost-effective one.
Managing Cash Flow
We manage cash flow by tracking inflow and outflow. This process can help with the future plans of our business to ensure sufficient funds.
Generating Reports
Generating business reports manually can be time-consuming, but FusionCharts makes it easier. We can generate external and internal reports to communicate effectively with our team.
Get Started With FusionCharts Accounting Dashboard
Accounting dashboards are a great way to highlight a business’s key patterns and trends. Moreover, businesses can focus more on other goals than just worrying about financial terms management.
Choosing the right tool plays an important role in implementing an accurate dashboard. FusionCharts dashboards provide amazing features to achieve more within less time. It gives your different types of dashboards to get the right dashboard.

FAQs
What Should Be on a Financial Dashboard?
It can include terms like expenses, savings, inflows, outflows, and many others.
What Is a P&L Dashboard?
It is a profit and loss dashboard that summarizes costs, revenue, and expenses.
What Is a CFO Dashboard?
It is a dashboard used by chief financial officers to visualize financial data.
What Are the Three Types of Dashboards?
Operational
Strategic
Analytical
Explore more on the charts to communicate your financial data story in this white paper.