Exporting Charts and Chart Data Using the Server-side Export Feature

FusionCharts Suite XT lets you export the charts rendered on a web page as images or PDFs. It also lets you export the chart data in an Excel spreadsheet.

FusionCharts Suite XT supports the following 3 modes of export:

  • Server-side export
  • Client-side export
  • Auto export (Default)

In this article, you will be shown how charts and chart data can be exported using the server-side exporting capabilities.

Enabling Server-side Export

Given below is the brief description of the attributes used to enable server-side exporting:

Attribute Name Type Range Description
exportEnabled Boolean 0/1 Enables the exporting feature in charts, when set to 1
Default value: 0 (the exporting feature is disabled)
exportMode String server, client, auto When chart exporting is enabled, this attribute is used to switch between the modes of export.
To enable client-side exporting, set this attribute to client.
Default value: auto (the auto exporting feature is enabled)
Note: Starting v3.12.1, the exportMode attribute replaces the exportAtClientSide attribute. However, you don’t need to make any changes to the existing setup because, starting v3.12.1, the FusionCharts library comes with the proper mapping already provided.
exportAtClientSide Boolean 0/1 Applicable only till v3.12.0
If chart exporting is enabled, this attribute is used to set whether charts will be exported on the client-side or the server-side.
Default value: 0 (server-side exporting is enabled)

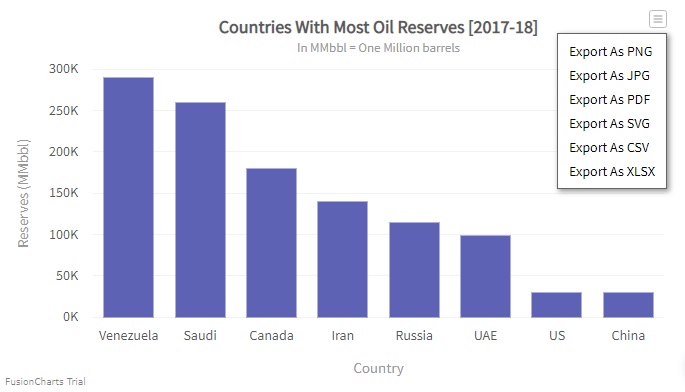
When exporting has been enabled for a chart, the chart is rendered with the export menu button, seen in the top right corner of the chart. Click/hover over the image button to display the export menu.

image

A live chart with server-side exporting enabled is shown below:

FusionCharts will load here..
{
    "chart": {
        "caption": "Monthly Revenue",
        "subCaption": "Last year",
        "xAxisName": "Month",
        "yAxisName": "Amount (In USD)",
        "numberPrefix": "$",
        "canvasBgAlpha": "0",
        "bgColor": "#DDDDDD",
        "bgAlpha": "50",
        "exportEnabled": "1",
        "exportMode": "server",
        "theme": "fusion"
    },
    "data": [
        {
            "label": "Jan",
            "value": "420000"
        },
        {
            "label": "Feb",
            "value": "810000"
        },
        {
            "label": "Mar",
            "value": "720000"
        },
        {
            "label": "Apr",
            "value": "550000"
        },
        {
            "label": "May",
            "value": "910000"
        },
        {
            "label": "Jun",
            "value": "510000"
        },
        {
            "label": "Jul",
            "value": "680000"
        },
        {
            "label": "Aug",
            "value": "620000"
        },
        {
            "label": "Sep",
            "value": "610000"
        },
        {
            "label": "Oct",
            "value": "490000"
        },
        {
            "label": "Nov",
            "value": "900000"
        },
        {
            "label": "Dec",
            "value": "730000"
        }
    ]
}
<chart caption="Monthly Revenue" subcaption="Last year" xaxisname="Month" yaxisname="Amount (In USD)" numberprefix="$" canvasbgalpha="0" bgcolor="#DDDDDD" bgalpha="50" exportenabled="1" exportmode="server" theme="fusion">
    <set label="Jan" value="420000" />
    <set label="Feb" value="810000" />
    <set label="Mar" value="720000" />
    <set label="Apr" value="550000" />
    <set label="May" value="910000" />
    <set label="Jun" value="510000" />
    <set label="Jul" value="680000" />
    <set label="Aug" value="620000" />
    <set label="Sep" value="610000" />
    <set label="Oct" value="490000" />
    <set label="Nov" value="900000" />
    <set label="Dec" value="730000" />
</chart>
<html>
<head>
	<title>My first chart using FusionCharts Suite XT</title>
	<script type="text/javascript" src="https://cdn.fusioncharts.com/fusioncharts/latest/fusioncharts.js"></script>
	<script type="text/javascript" src="https://cdn.fusioncharts.com/fusioncharts/latest/themes/fusioncharts.theme.fusion.js"></script>
	<script type="text/javascript">
		FusionCharts.ready(function(){
			var chartObj = new FusionCharts({
    type: 'column2d',
    renderAt: 'chart-container',
    width: '500',
    height: '300',
    dataFormat: 'json',
    dataSource: {
        "chart": {
            "caption": "Monthly Revenue",
            "subCaption": "Last year",
            "xAxisName": "Month",
            "yAxisName": "Amount (In USD)",
            "numberPrefix": "$",
            "canvasBgAlpha": "0",
            "bgColor": "#DDDDDD",
            "bgAlpha": "50",
            //Enabling chart export
            "exportEnabled": "1",
            //Enabling server-side export
            "exportMode": "server",
            "theme": "fusion"
        },

        "data": [{
            "label": "Jan",
            "value": "420000"
        }, {
            "label": "Feb",
            "value": "810000"
        }, {
            "label": "Mar",
            "value": "720000"
        }, {
            "label": "Apr",
            "value": "550000"
        }, {
            "label": "May",
            "value": "910000"
        }, {
            "label": "Jun",
            "value": "510000"
        }, {
            "label": "Jul",
            "value": "680000"
        }, {
            "label": "Aug",
            "value": "620000"
        }, {
            "label": "Sep",
            "value": "610000"
        }, {
            "label": "Oct",
            "value": "490000"
        }, {
            "label": "Nov",
            "value": "900000"
        }, {
            "label": "Dec",
            "value": "730000"
        }]
    }
}
);
			chartObj.render();
		});
	</script>
	</head>
	<body>
		<div id="chart-container">FusionCharts XT will load here!</div>
	</body>
</html>

Note: Go to the JSON tab to see how the exportEnabled and exportMode attributes have been used in the JSON tab.

Features of Server-side Exporting

Using the server-side mode of exporting ensures that the exported image has exactly the same quality as the image on the web page. This mode ensures a successful export with a public server as well as a private export server that has been set up correctly.

The complete export process is carried out on the server-side. All exports, therefore, will require a round-trip from the server, which might add to the time it takes to export a chart, depending on the file size, and the network speed.

Two very prominent features of server-side exporting, introduced in v3.12.1, are the support for downloading CORS-enabled embedded images and the logging of export server statistics.

CORS-enabled Embedded Image Support

Previously, if the exported chart included an image from an external host (for example, file hosting services like Imgur, AWS S3), the image was removed if the chart was downloaded using the client-side export feature. This limitation was due to browser security restrictions w.r.t exporting such images. Server export, however, never had such a restriction.

In the current implementation, the limitation has been refined to allow embedded images from external hosts that have the Access-Control-Allow-Origin header set to allow. This allows images in the current domain, the domain in which the chart is rendered, to be downloaded on the client-side, thus also enabling support for a lot of popular image services.

Logging Export Statistics

The log server as well as export server can now save the export data, which is the metadata of every export done by the client, along with the timestamp. In case of server-side export and auto-export, both of which involve a call to the export server in the export process flow, the export server handles the logging details. In case of client-side export, wherein the entire exporting process is carried out on the client, the client makes a separate call to the log server, which then handles the logging details.

An analytics UI has also been developed in such a way that the log reports will work in all modern browsers and can be easily consumed by the users. This also helps the administrator to easily keep a tab on the entire volume of exports as well as on individual exports.