Rendering Funnel Chart Using FusionCharts and MVC in .NET Framework
FusionCharts.NET is a popular charting library for ASP.NET WebForms, Razor Page, and MVC in .NET Framework, .NET Core, and .NET Standard. It taps into the FusionCharts JavaScript (HTML5) library to render interactive charts.That means you do not have to write complex JavaScript and JSON code. You can instead use the methods and properties provided by FusionCharts .NET to render charts in C# or VB.NET, without hassle.
Architecture Overview
You can understand the basic architecture of FusionCharts.NET at a glance from the diagram given below:
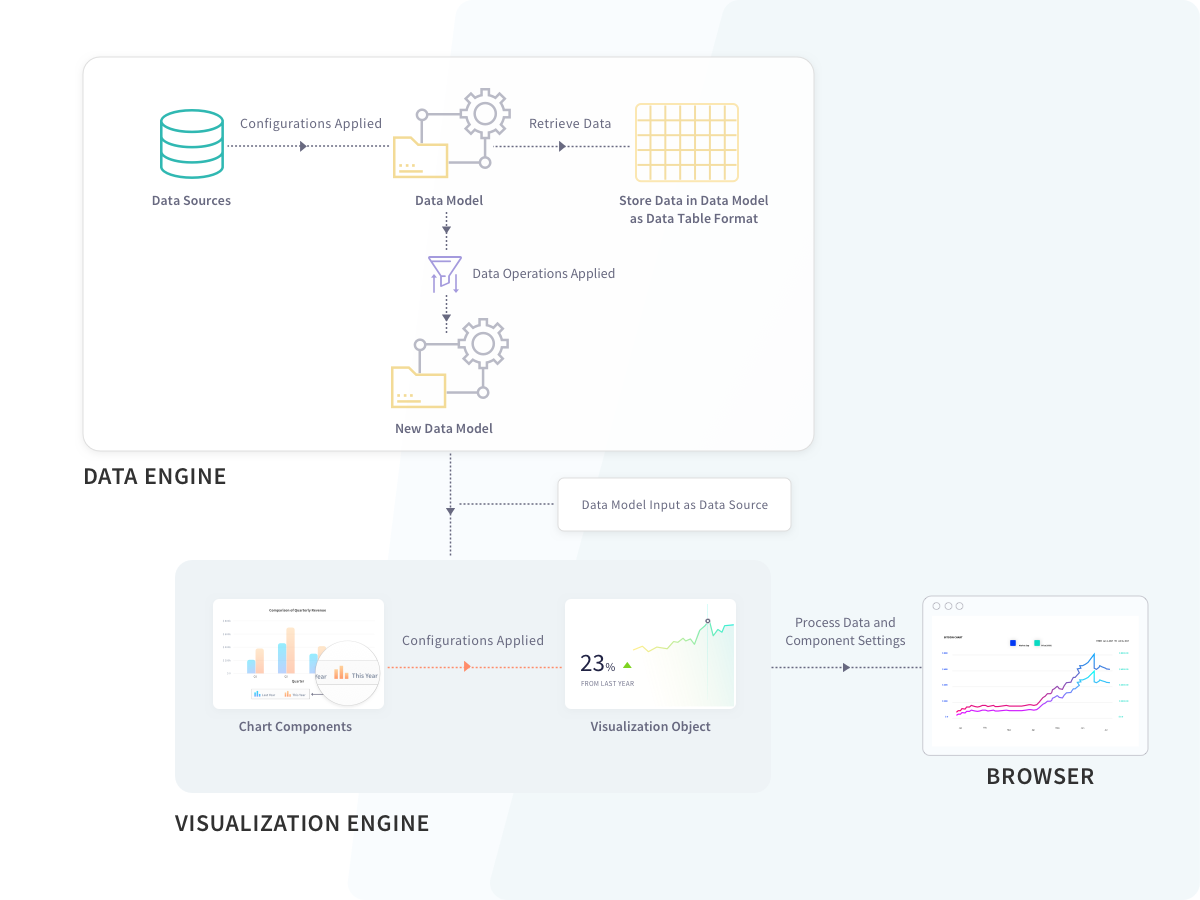
As you can see, FusionCharts.NET is structured into two major modules - the Data Engine and the Visualization Engine. The first one deals with the data, while the second takes care of the rendering process and displays the chart on the browser.
Data Engine
The Data Engine of FusionCharts.NET lets you store data and perform various operations on it. That way, you get plenty of options to optimize and transform the data to suit your requirements, before you send it to the chart renderer. The Data Engine consists of the following:
- Data Sources, which receives the raw data and creates an object to provide the data to the DataModel.
- Data Operations, which you can apply to a DataModel, to create another optimized DataModel. You can send any of these DataModels to the Visualization Engine.
- DataModel, which receives and stores optimized data. The Visualization Engine of FusionCharts.NET can only accept data in the form of a DataModel to render a chart.
Prerequisite
Before you can build charts with FusionCharts.NET, you need to configure your system to have these loaded:
- Visual studio IDE and .NET framework v3.5 (or later)
- FusionCharts Suite XT, which you can download from here.
- FusionCharts.NET assembly, which you can get here. FusionCharts.NET supports many different types of charts. You can find them all listed here. In this blog, you will see how to render a funnel chart in .NET.
Step 1
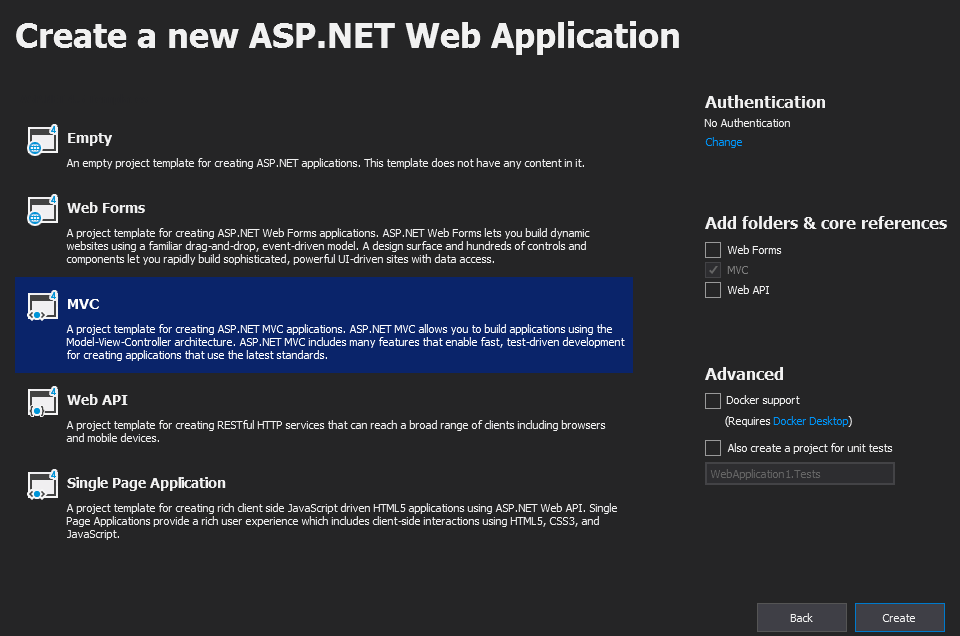
Create a web application in Visual Studio. Open Visual Studio and follow the steps mentioned below:
- Click on Create a New Project → ASP.NET Web Application (.NET Framework)
- Type the project name.
- Click on Create.
- Click on MVC (as shown in the screenshot below).
- Click on Create.
Step 2
Next, you have to add Fusioncharts JavaScript files to this project. Right click on the Scripts folder and follow the steps mentioned below:
- Click on Add Existing Item.
- Browse to FusionCharts JavaScript files and add them.
When you are done, the Solution Explorer will look like the following:

Step 3
Now, add a new View in this project. The chart will be rendered inside this view. To do so, right click on the Views folder and follow the steps mentioned below:
- Click on Add
- Click on View…
- Click on MVC 5 View
- Click on Add
- Type the name of the View as FunnelChart (as shown in the screenshot below)
- Click on Add.

Step 4
Now, add reference of FusionCharts JavaScript files and necessary tags in this view. Navigate to the FunnelChart.cshtml page and add the following lines:
@{ Layout = null; }
<html>
<head>
<script src="@Url.Content("/Scripts/FusionCharts/FusionCharts.js")"></script>
<script src="@Url.Content("/Scripts/FusionCharts/fusioncharts.widgets.js")"></script>
<script src="@Url.Content("/Scripts/FusionCharts/themes/fusioncharts.theme.fusion.js")"></script>
</head>
<body>
<div>
<div id="chartContainer">@Html.Raw(ViewData["Chart"])</div>
</div>
</body>
</html>Step 5
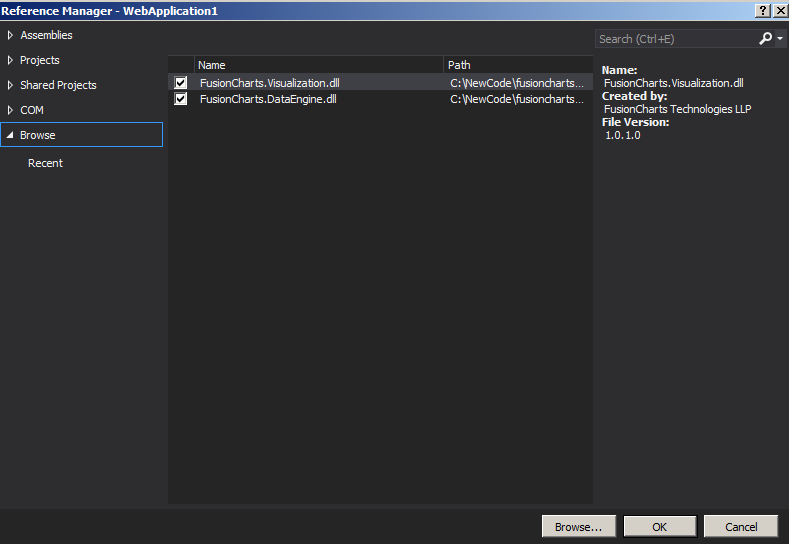
It's time to add reference of FusionCharts.NET in this application. To do so, right click on References and follow the steps mentioned below:
- Click on Add Reference
- Browse to and add both FusionCharts.Visualization.dll and FusionCharts.DataEngine.dll (as shown in the screenshot below)
- Click Ok.
Step 6
Now you need to use FusionCharts.DataEngine and FusionCharts.Visualization reference in controller. To do that, open the Controller folder. Then, open the HomeController.cs file and add the following lines:
using FusionCharts.DataEngine;
using FusionCharts.Visualization;Step 7
Open HomeController.cs and add a new action, FunnelChart(). This action will return the chart rendering string to FunnelChart.cshtml. Within this action, you need to write the code to build a chart object. In this example, you will fetch data from a DataTable. Apart from this, you can also fetch data from SQL Server, a JSON file, or a CSV file.
Add the following code in the FunnelChart action:
public ActionResult FunnelChart() {
// Create Data table
DataTable ChartData = new DataTable();
// Add column to data table
ChartData.Columns.Add("Label", typeof(System.String));
ChartData.Columns.Add("Value", typeof(System.Double));
// Add rows to data table
ChartData.Rows.Add("Unique Website Visits", 1460000);
ChartData.Rows.Add("Programme Details Section Visits", 930000);
ChartData.Rows.Add("Attempts to Register", 540000);
ChartData.Rows.Add("Successful Registrations", 210000);
ChartData.Rows.Add("Logged In", 190000);
ChartData.Rows.Add("Purchased on Introductory Offers", 120000);
// Create Static source with the data table
StaticSource source = new StaticSource(ChartData);
// Create an instance of DataModel
DataModel model = new DataModel();
// Add data sources to DataModel
model.DataSources.Add(source);
// Instantiate the Funnel Chart, it is under Widget class
Widget.FunnelChart funnel = new Widget.FunnelChart("first_Funnel_chart");
// Set model object as the data source of funnel
funnel.Data.Source = model;
// Set caption
funnel.Caption.Text = "Visit to purchase analysis";
// Set Sub caption***
funnel.SubCaption.Text = "Visit to purchase- Conversion Analysis for last year";
// Set height and width of the chart
funnel.Width.Pixel(600);
funnel.Height.Pixel(400);
// Set chart theme
funnel.ThemeName = FusionChartsTheme.ThemeName.FUSION;
// Set chart rendering string in ViewData as a key-value pair
ViewData["Chart"] = funnel.Render();
// Return the view
return View();
}Rendered Widget
The output chart will look as shown below:

Click here to edit a funnel chart.