Render FusionCharts in MVC Using .NET Framework
FusionCharts.NET is an extensive charting library for ASP.NET WebForms and MVC, in .NET Framework, .NET Core and .NET Standard. It takes advantage of the FusionCharts JavaScript (HTML5) library to render interactive charts. This means you do not need to write complex JavaScript and JSON code anymore. Simply use the methods and properties provided by FusionCharts .NET to render charts in C# or VB.NET.
Architecture Overview
You can see the basic architecture of FusionCharts.NET in the diagram given below:
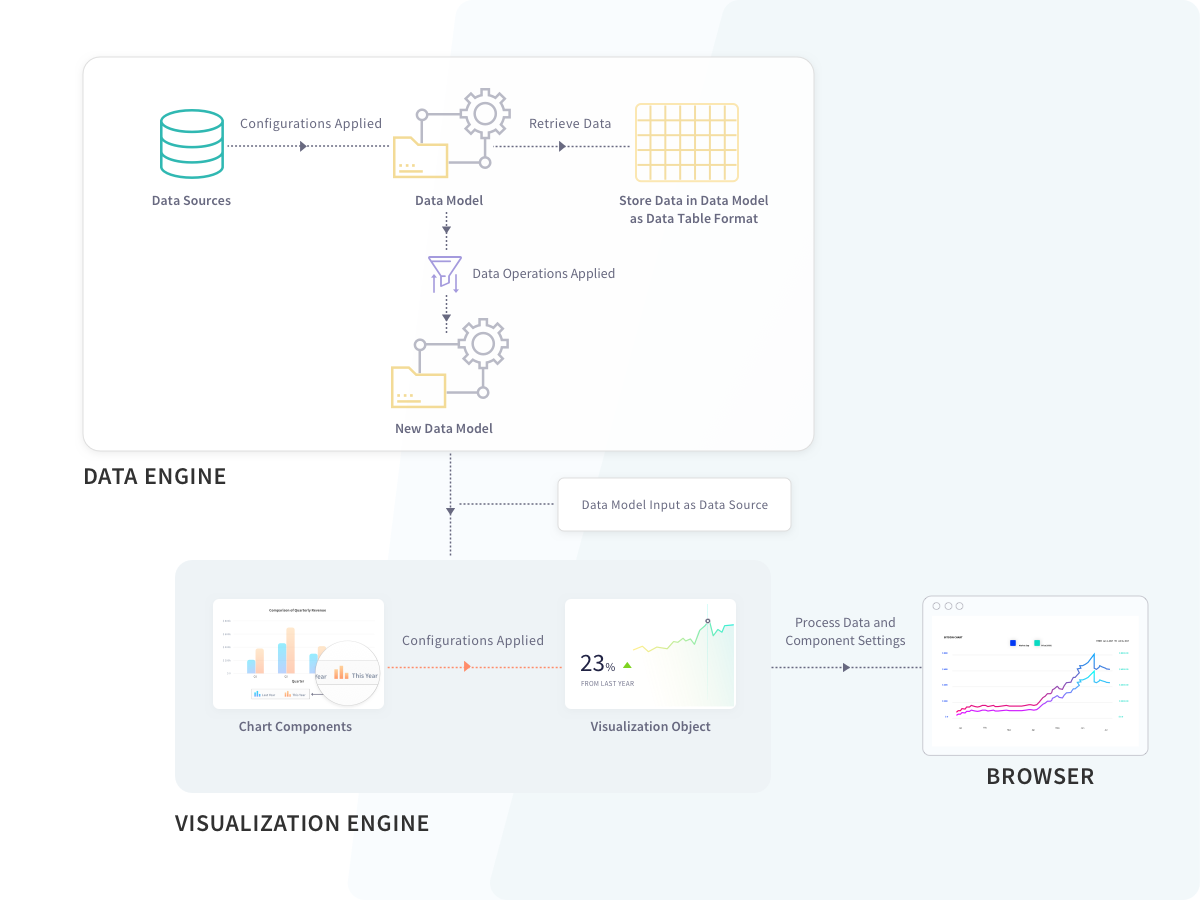
FusionCharts.NET is structured into two major modules - the Data Engine and the Visualization Engine. The former processes the data, while the latter renders the chart on the browser.
Data Engine
The Data Engine of FusionCharts.NET helps you store data and run different data operations on it. You can optimize and transform the data the way you need before you send it to the Visualization Engine for rendering. The Data Engine consists of the following:
Data Source, which receives the raw data and creates an object to provide the data to the DataModel.
Data Operations, which you can apply to a DataModel, to create another optimized DataModel. You can send any of these DataModels to the Visualization Engine.
DataModel, which receives and stores optimized data. The Visualization Engine of FusionCharts.NET can only accept data in the form of a DataModel to render a chart.
Prerequisites
Before you can build charts with FusionCharts.NET, you need to configure your system to have these loaded:
Visual Studio IDE and .NET Framework v3.5 (or later)
FusionCharts Suite XT, which you can download from here.
FusionCharts.NET assembly, which you can get here.
FusionCharts.NET supports many different types of charts. You can find them all listed here. In this blog, you will see how to create a column chart with FusionCharts .NET and ASP.NET.
Step 1
Create a web application in visual studio. Open Visual Studio and follow the steps mentioned below:
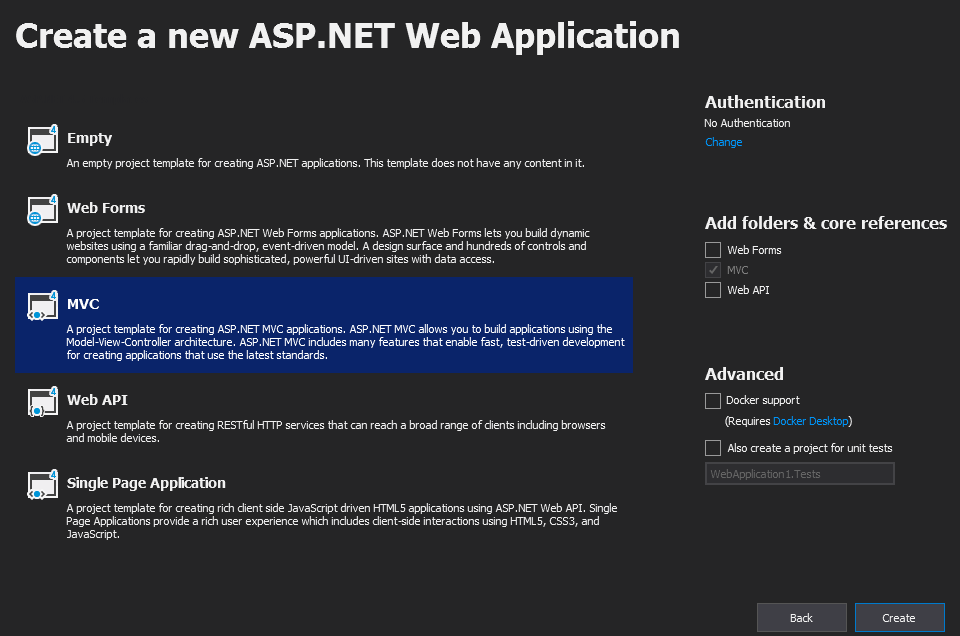
Click on Create a New Project → ASP.NET Web Application (.NET Framework)
Type the project name.
Click on Create.
Click on MVC (as shown in the screenshot below).
Click on Create.
Step 2
Now, add Fusioncharts JavaScript files to this project. Right-click on Scripts folder and do the following:
Click on Add Existing Item.
Browse to FusionCharts JavaScript files and add them one by one.
When you are done, the solution explorer will look like the following:

Step 3
Now, add a new View in this project. The chart will be rendered inside this view. To do so, right-click on the Views folder and follow the steps mentioned below:
Click on Add
Click on View…
Click on MVC 5 View
Click on Add
Type the name of the View as ColumnChart (as shown in the screenshot below)
Click on Add.

Step 4
Now, add reference of FusionCharts JavaScript files and necessary tags in this view. Navigate to the ColumnChart.cshtml page and add the following lines:
@{ Layout = null; }
<html>
<head>
<script src="@Url.Content("/Scripts/FusionCharts/FusionCharts.js")"></script>
<script src="@Url.Content("/Scripts/FusionCharts/themes/fusioncharts.theme.fusion.js")"></script>
</head>
<body>
<div>
<div id="chartContainer">@Html.Raw(ViewData["Chart"])</div>
</div>
</body>
</html>Step 5
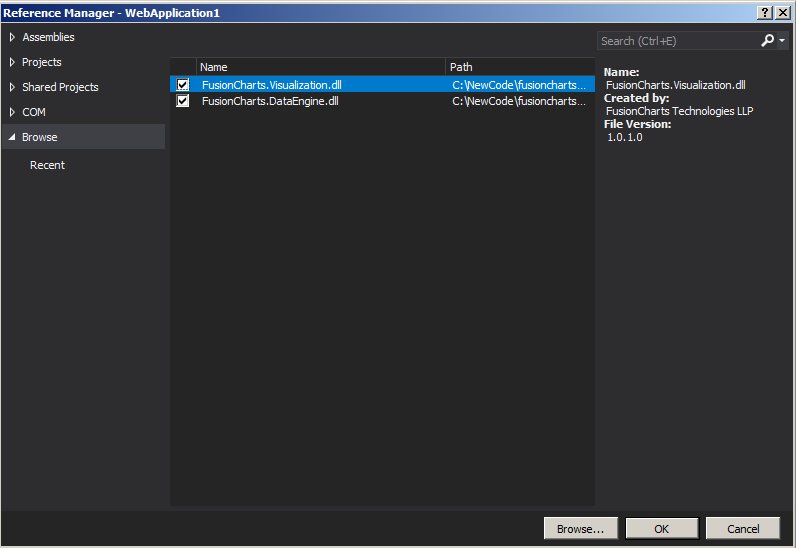
It's time to add reference to FusionCharts.NET in this application. To do so, right-click on References and follow the steps mentioned below:
Click on Add Reference
Browse to and add both FusionCharts.Visualization.dll and FusionCharts.DataEngine.dll (as shown in the screenshot below)
Click Ok.
Step 6
Next, you need to use references to FusionCharts.DataEngine and FusionCharts.Visualization in the controller. To do that, open the Controller folder and add the following lines to the HomeController.cs file:
using FusionCharts.DataEngine;
using FusionCharts.Visualization;Step 7
Open HomeController.cs and add a new action, ColumnChart(). This action will return the chart rendering string to ColumnChart.cshtml. Within this action, you need to write the code to build a chart object. In this example, you will fetch data from a DataTable. Apart from this, you can also fetch data from SQL Server, a JSON file, or a CSV file.
Add the following code in the ColumnChart action:
public ActionResult ColumnChart() {
// Create data table to store data
DataTable ChartData = new DataTable();
// Add columns to data table
ChartData.Columns.Add("Programming Language", typeof(System.String));
ChartData.Columns.Add("Users", typeof(System.Double));
// Add rows to data table
ChartData.Rows.Add("Java", 62000);
ChartData.Rows.Add("Python", 46000);
ChartData.Rows.Add("Javascript", 38000);
ChartData.Rows.Add("C++", 31000);
ChartData.Rows.Add("C#", 27000);
ChartData.Rows.Add("PHP", 14000);
ChartData.Rows.Add("Perl", 14000);
// Create static source with this data table
StaticSource source = new StaticSource(ChartData);
// Create instance of DataModel class
DataModel model = new DataModel();
// Add DataSource to the DataModel
model.DataSources.Add(source);
// Instantiate Column Chart
Charts.ColumnChart column = new Charts.ColumnChart("firstchart");
// Set the width and the height of the chart
column.Width.Pixel(700);
column.Height.Pixel(400);
// Set DataModel instance as the data source of the chart
column.Data.Source = model;
// Set Chart Caption
column.Caption.Text = "Most popular programming language";
// Set Chart Subcaption
column.SubCaption.Text = "2017-2018";
// Hide Chart Legend
column.Legend.Show = false;
// Set X-axis Text
column.XAxis.Text = "Programming Language";
// Set Y-axis title
column.YAxis.Text = "User";
// Set chart theme
column.ThemeName = FusionChartsTheme.ThemeName.FUSION;
// Set chart rendering string in ViewData as a key-value pair
ViewData["Chart"] = column.Render();
// Return the view
return View();
}Rendered Chart
The output chart will look like the screenshot given below:

Click here to edit the column chart.
Render Column Chart with Multiple Series
If the DataModel has more than one value column, the Visualization Engine will automatically render a Multi Series Column Chart.
Click here to edit a column chart with multiple value fields.
Render 3D Column Chart
If you set the ThreeD property to true (using the code shown below), the Visualization Engine will render a 3D column chart.
column.ThreeD = true;Click here to edit a ThreeD column chart.
Render Overlapped Column Chart
If the DataModel has two or more value columns and you set the Overlapped property to true, then the Visualization Engine will render an overlapped column chart.
column.Overlapped = true;Click here to edit an overlapped column chart.
Render Scrollable Column Chart
If you set the Scrollable property to true (using the code shown below), the Visualization Engine will render a Scrollable Column chart.
column.Scrollable = true;Click here to edit a scrollable column chart.