Learn how to export a dashboard | FusionExport
Building an impressive dashboard involving numerous charts and visualisations takes time, effort and infinite lines of code. But your job is not over yet. Your PM comes and asks to add export functionality and your real pain starts. You would have encountered situations like when you were trying to export a dashboard that includes scroll bars, the exported PDF might include only visible data. Many a times, the panel/page is cut off and not all the rows are visible thereby displaying incomplete data. To make things even worse, data visualisation charts/graphs on the dashboard when exported often come with readability issues or in most cases are not print-friendly. Still thinking about exporting one now?
FusionExport enables you to convert your live dashboards to PDF or you can further use this to send emails with reports as attachments or send scheduled emails using CRON jobs. The users can download any dashboards which they are viewing in their browser, with just one click. Or, they can even change the template of exported dashboard to include your logo, additional elements like data tables, or even the layout. Whether you use FusionCharts, Charts.js, HighCharts, D3.js or others, FusionExport can work with all of them seamlessly to export your dashboards.
For this tutorial, we will focus on exporting dashboard rather than building an entire dashboard. To learn how to build a dashboard read this tutorial - ”Building a Sales Dashboard”.
Setting up the project using a boilerplate
We have built a dashboard for you using FusionCharts and Vue.js and made it open source. Hence, we will simply clone this repository and start running the dashboard. The boilerplate will be installed along with all utilities and dependencies.
The tech stack used for the dashboard is Laravel (backend) and Vue.js (frontend). Let’s get started now, open the terminal and enter:
$ git clone [email protected]:fusioncharts/fusionexport-dashboard-sample-php.git
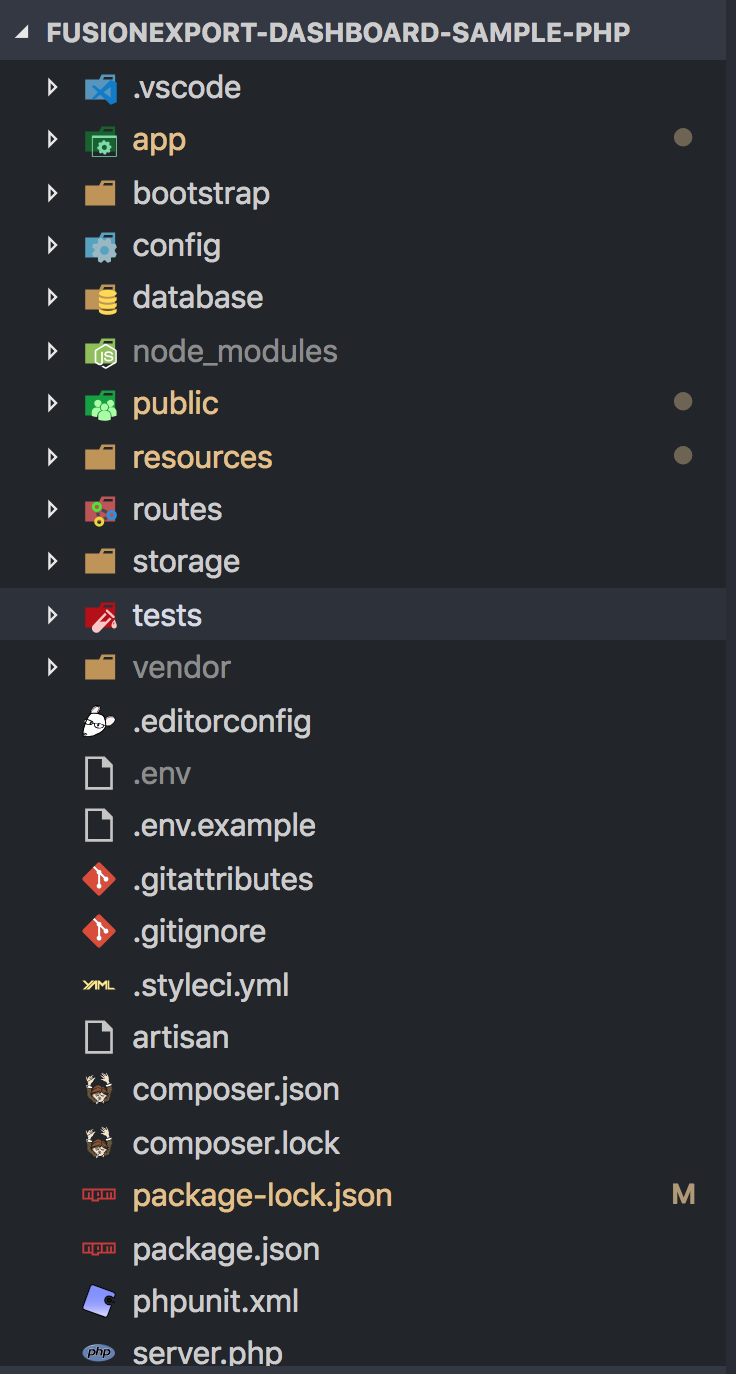
$ cd fusionexport-dashboard-sample-phpThe project structure after cloning the repository will look like the snapshot:
Including Node.js Modules
After cloning the directory, install all the Node.js modules for the client side. We have also written a custom script which will compile all the resources so that the dashboard is up and running.
$ npm install && npm run prodIncluding PHP Modules
Composer is the tool used for dependency management in PHP. It allows you to declare the PHP libraries as per the project requirements (installing them in a directory) and will manage them for you. Similar to Node.js modules, install Laravel modules as well:
$ composer installTo load the localhost server on the browser, enter in the terminal as below:
$ php artisan serveVisit http://localhost:8000 to confirm that the dashboard is running on your localhost server.
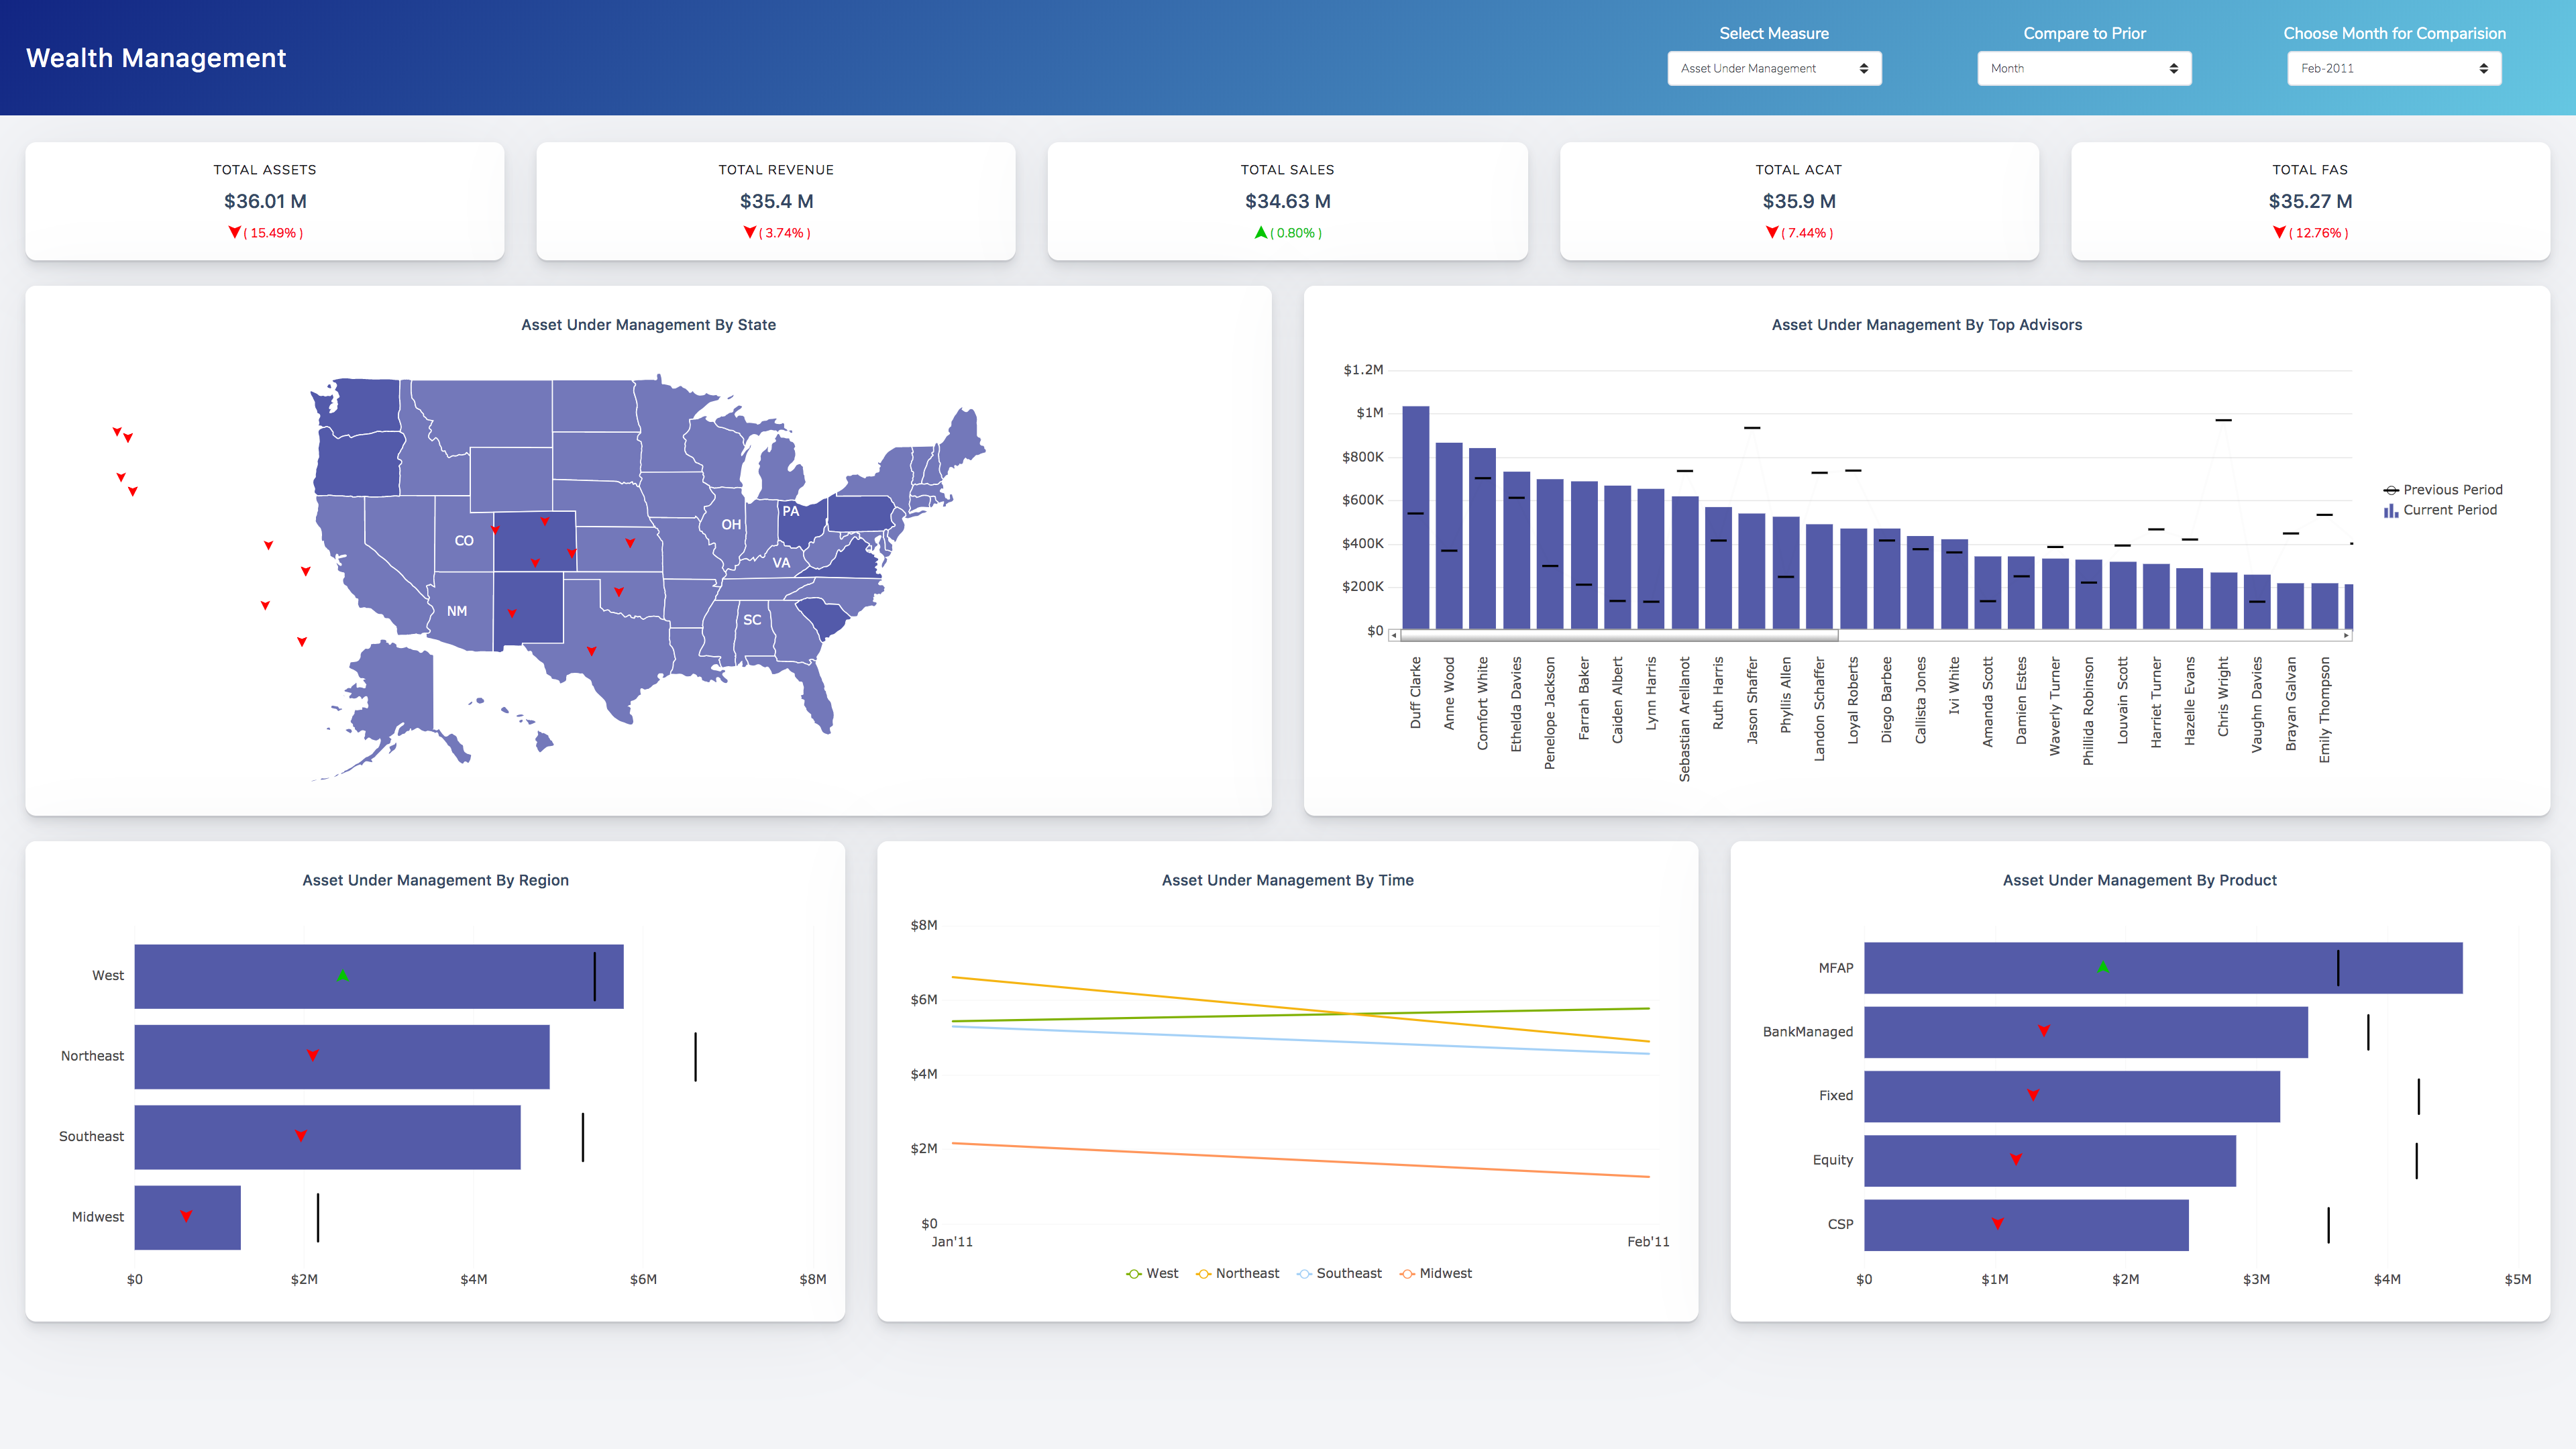
Let’s take a look at the live-link of of the Wealth Management Dashboard here.
Architecture of the export functionality
Now that we have set up the dashboard, let’s take a step back and plan how we are going to implement the export functionality. There are three major steps involved in the implementation:
- Create an API endpoint: This endpoint will accept chart configurations of the dashboard via our Vue.js application.
- Configure an HTML template: Configure the HTML template of the dashboard which we want to be generated in the PDF.
- Export using FusionExport Server: Once you have the chart configurations and HTML template, pass it to FusionExport and get the PDF file in return. This PDF file will be sent back to the client.
Diagram below would give you a better understanding of the overall flow:

Adding a new endpoint for export
The back-end code in Laravel lies within app folder. Let’s add a new route called api.php in the routes folder which will handle the export related API end point. This end point will be used by our Vue.js project to send the request to export the dashboard from client side.
<?php
use Illuminate\Http\Request;
Route::post('export/download-dashboard', 'API\ExportController@downloadDashboard');
?>The routes in routes/api.php are stateless and are assigned the api middleware group.
Exporting a single chart using FusionExport
Before we go ahead and export a single chart, we need to install FusionExport server on our machine and set it up in out Laravel project as well. To download the FusionExport server, click here. Once you have downloaded FusionExport, run the server by running following command:
$ ./fusionexportThis will start the FusionExport server on your localhost:1337. Now that we have FusionExport export server running, let’s install the PHP SDK client for FusionExport using composer:
composer require fusioncharts/fusionexportTo use the SDK in your project, let’s create a PHP file and name it as ExportController.php and place it under app/Http/Controllers/API/ Now go ahead and add this in the file:
use FusionExport\ExportManager;
use FusionExport\ExportConfig;To learn more about exporting FusionExport Server SDK’s , check this link out.
Now, let’s go to the file ExportController.php which we had created, where we will be handling the entire Laravel code for export functionality.
We will create a public function downloadDashboard within the PHP file. This function is called when a request to ‘/explore/download-dashboard’ is sent which fetches the chart configs and other data from the HTTP request which was sent via Vue.js. Once, we have fetched all the information from the request, we will instantiate FusionExport. Simultaneously, we will also get the HTML template which we will be using in PDF generation (explained in the next section). Pass all the information to FusionExport and get the PDF in return. Once the export is completed, the response file is downloaded to the local folder which is further passed to the client.
<?php
namespace App\Http\Controllers\API;
use FusionExport\ExportManager;
use FusionExport\ExportConfig;
class ExportController extends Controller
{
public function __construct()
{
$this->singlePageTemplate = file_get_contents(__DIR__ . '/templates/single.html');
}
public function downloadDashboard(Request $request)
{
// Step 1: Fetch chart configurations and header from client
$headerText = $request->input('headerText');
$chartConfigs = $request->input('chartConfigs');
// Step 2: Get the HTML template and add the header in it
$tmpl = str_replace('<%= headerText %>', $headerText, $this->singlePageTemplate);
$tmplFile = tempnam(sys_get_temp_dir(), 'fe-');
file_put_contents($tmplFile, $tmpl);
// Step 3: Instantiate FusionExport modules like ExportManager & ExportConfig
$exportManager = new ExportManager();
$exportConfig = new ExportConfig();
// Step 4: Pass chart configurations and export
$exportConfig->set('chartConfig', $chartConfigs);
$exportConfig->set('templateFilePath', $tmplFile);
$exportConfig->set('type', 'pdf');
$files = $exportManager->export($exportConfig, sys_get_temp_dir(), true);
// Step 5: Send the PDF to the client
return response()->download($files[0]);
}
}Create a template for PDF
You can directly pass the chart configs to FusionExport and it will return a PDF of the chart. But if you need to add more than one chart or headers (which we need in this example) FusionExport allows you to send HTML template which will get converted to PDF.
Let’s go ahead and create the single.html in templates folder in the same directory where ExportController.php is present. Now, we are defining the HTML for a single chart render.
<!DOCTYPE html>
<html lang="en">
<head>
<meta charset="UTF-8" />
<meta name="viewport" content="width=device-width, initial-scale=1.0" />
<meta http-equiv="X-UA-Compatible" content="ie=edge" />
<title>Wealth Management</title>
<link
href="https://fonts.googleapis.com/css?family=Source+Sans+Pro:400,600"
rel="stylesheet"
type="text/css"
/>
<style>
-- Include the stylesheet here --
</style>
</head>
<body>
<div class="dashboard-container">
-- Insert Code here to add header --
<div class="dashboard-row">
<div class="chart">
<div class="chart-block">
<div class="sec-chart" id="chart-container-top-adv"></div>
</div>
</div>
</div>
</div>
</body>
</html>As you can see above, we have added few more resources like Google Fonts which are downloaded automatically while the exporting is happening. But the most important code snippet in the above code, is given below.
<div class="dashboard-row">
<div class="chart">
<div class="chart-block">
<div class="sec-chart" id="chart-container-top-adv"></div>
</div>
</div>
</div>In the code snippet above you can id=chart-container-top-adv determines the mapping between chart configuration and the div where chart will get rendered. These ids are mapped in chart configurations against renderAt attribute. Sample chart configuration for the same is given below:
{
"type": "scrollcombidy2d",
"renderAt": "chart-container-top-adv",
"width": "100%",
"height": "100%",
"dataFormat": "json",
"dataSource": {
"chart": {
"paletteColors": "#5F66B1",
"legendPosition" : "RIGHT",
"reverseLegend" : "1",
"legendIconBorderColor" : "transparent",
"legendIconBgColor" : "transparent",
"legendIconStartAngle" : "90",
"alignLegendWithCanvas" : "0"
},
"categories": [{
"category": JSON.parse(labels)
}]
...
}
}Adding style to the PDF
The stylesheet contains all the styles and CSS techniques for our dashboard. This has to be embedded within the <style> Insert code here </style> block of the template. For this tutorial, I have already made some CSS using Bootstrap which you’ll find below:
<style>
body {
font-family: 'Source Sans Pro', sans-serif;
margin: 0;
background-color: #f8f9fd;
}
.dashboard-container {
box-sizing: border-box;
padding-left: 8px;
padding-right: 8px;
background-color: #f8f9fd;
padding: 30px;
}
.dashboard-container .dashboard-row {
margin-left: -8px;
margin-right: -8px;
}
.dashboard-container .dashboard-row:after {
content: '';
display: table;
clear: both;
}
.dashboard-container .dashboard-row .intro-block,
.dashboard-container .dashboard-row .chart {
box-sizing: border-box;
padding: 8px 8px;
}
.dashboard-container .dashboard-row .chart {
width: 50%;
float: left;
}
.dashboard-container .dashboard-row .chart:first-child {
box-sizing: border-box;
float: initial;
width: 100%;
}
.dashboard-container .dashboard-row .chart .chart-block {
background-color: #fff;
border: 1px solid #f0f1f7;
border-radius: 4px;
padding: 10px;
box-shadow: 0 2px 10px 0 rgba(33, 35, 68, 0.05) !important;
}
.sec-chart {
width: auto;
height: 400px;
}
.dashboard-container .mt-0 {
margin-top: 0;
}
.dashboard-container hr {
border: none;
border-top: 1px dotted rgba(49, 49, 49, 0.09);
margin: 25px 0 15px;
}
</style>Send Export request from Vue.js app
Now that our backend is setup, let’s go ahead and add an Export Button in the file ExportHandle.vue file, which on-click exports the dashboard into PDF format. As explained earlier, this should send a request to /export/dashboard-download. The request should include chart configurations and other details like header text.
<button type="button" class="btn export-handle-button" @click="exportClickListener">
<i class="icn icn-download" />
<span>Export Dashboard</span>
</button>For those who don’t know Vue.js, in the above code we are calling exportClickListener method when button is clicked. The button is disabled for a particular time span before enabling it again for further export. Also, how we are using FusionExport in Laravel is explained in the next section but let us assume that you are getting a PDF file as a response.
The ExportHandle.vue houses the code for sending requests to the baseUrl, retrieving the header text and chart configs, and returning the response as a pdf file.
methods:{
async exportClickListener(evt) {
const button = evt.currentTarget;
const icon = button.querySelector('i.icn');
const downloadIconClass = 'icn-download';
const loadingIconClass = 'icn-loading';
button.disabled = true;
icon.classList.replace(downloadIconClass, loadingIconClass);
await this.exportDashboard();
button.disabled = false;
icon.classList.replace(loadingIconClass, downloadIconClass);
},
async exportDashboard() {
const url = `${baseUrl}/export/download-dashboard`;
const headerText = this.getHeaderText();
const chartConfigs = Object.values(this.chartConfig);
const res = await axios.post(url, {
headerText,
chartConfigs,
}, {
responseType: 'blob'
});
download(res.data, 'Wealth Dashboard.pdf', 'application/pdf');
},
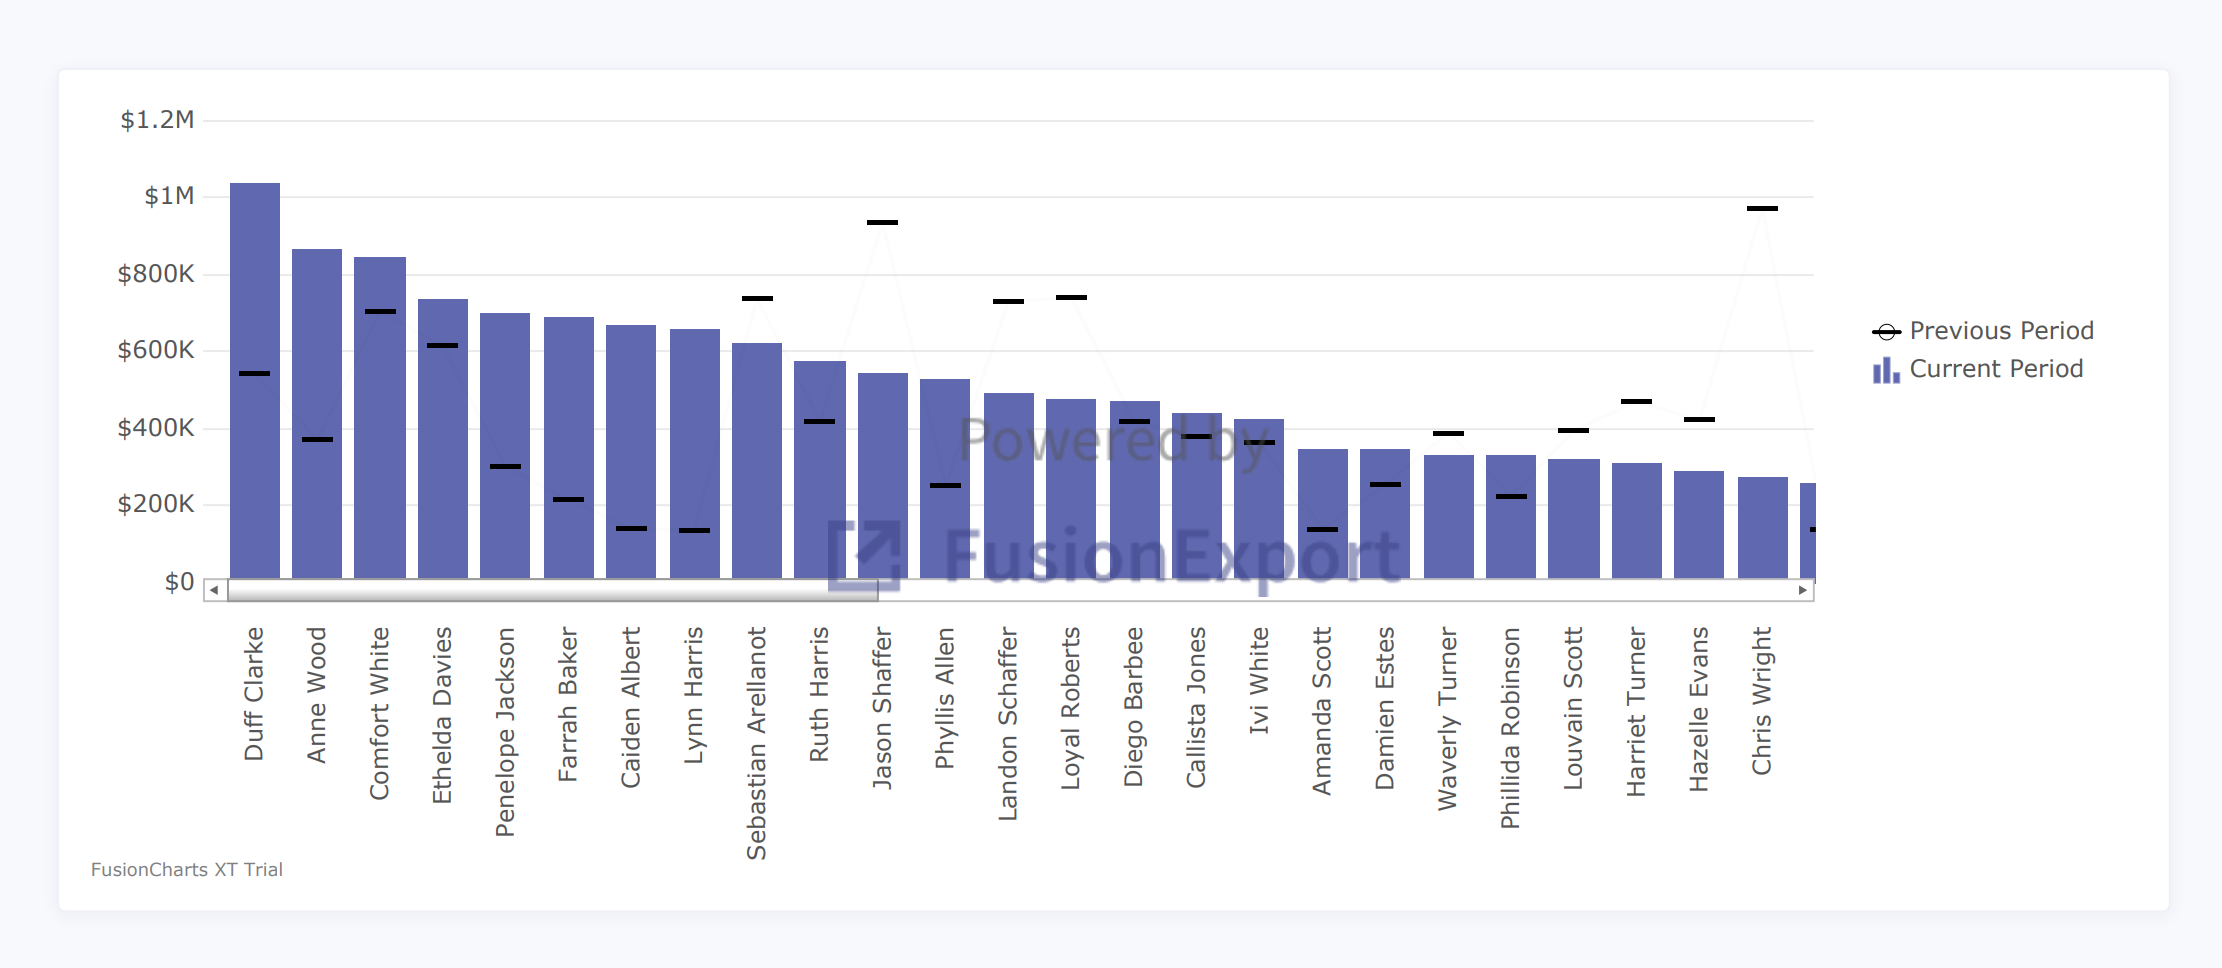
}We have declared actions.js within the store folder where all the chart configurations are pre-defined. The RenderChart.vue caters to all the needs for chartConfigs. To understand and learn about the chart configurations better, take a look at code snippet on Vue here. Once everything is configured properly, clicking on the Export button will send a PDF in return. The output dashboard will look like the snapshot below:
Exporting multiple charts
Now, let’s move further and export multiple charts from the dashboard. I have built the code snippet for the modified template as given below:
<body>
<div class="dashboard-container">
-- Insert Code here to add header --
<div class="dashboard-row">
<div class="chart"></div>
<div class="chart">
<div class="chart-block">
<div class="sec-chart" id="chart-container-top-adv"></div>
</div>
</div>
<div class="chart">
<div class="chart-block">
<div class="sec-chart" id="chart-container-reg"></div>
</div>
</div>
<div class="chart">
<div class="chart-block">
<div class="sec-chart" id="chart-container-reg-monthly"></div>
</div>
</div>
<div class="chart">
<div class="chart-block">
<div class="sec-chart" id="chart-container-product"></div>
</div>
</div>
</div>
</div>
</body>Additionally, we are adding extra CSS for dashboard container and primary chart. Below code snippet has to embedded along with the existing stylesheet.
...
padding: 8px 8px;
}
.dashboard-container .dashboard-row .intro-block h1 {
margin-bottom: 10px;
}
...
box-shadow: 0 2px 10px 0 rgba(33, 35, 68, 0.05) !important;
}
.pri-chart {
width: auto;
height: 600px;
}
.sec-chart {
width: auto;
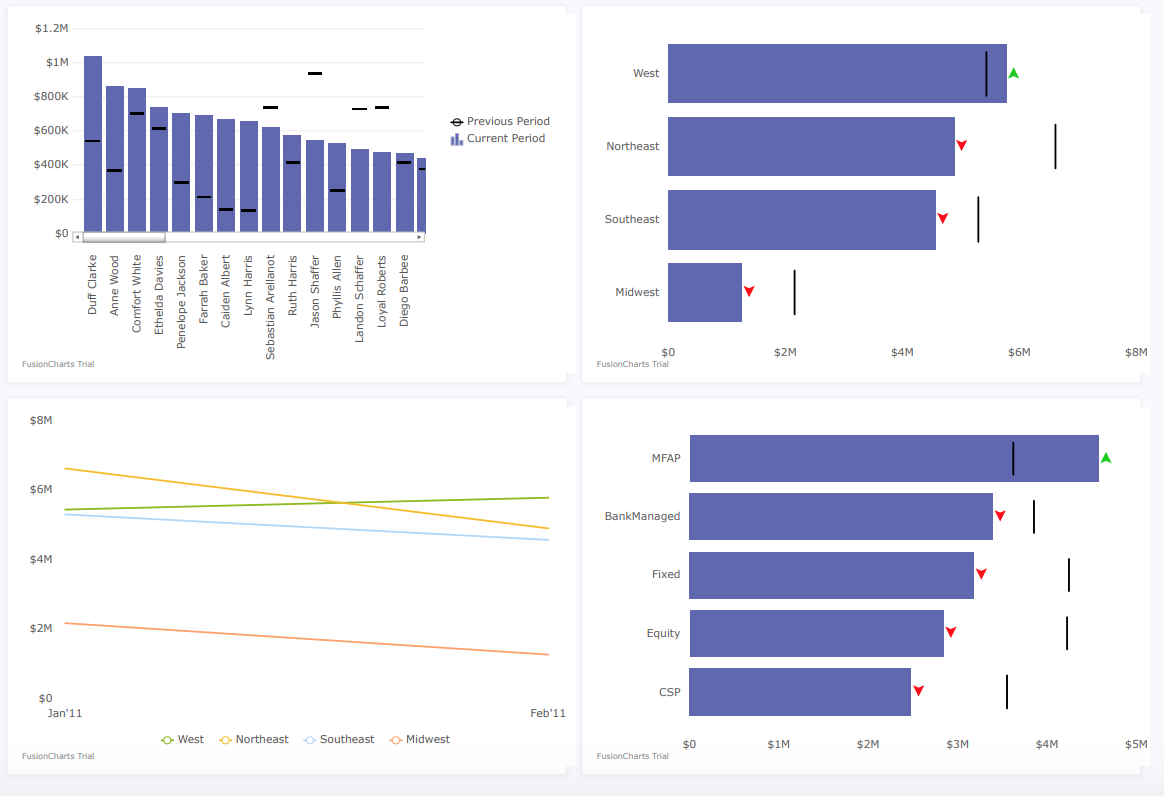
...As mentioned earlier, id for all the divs should be mapped properly in the chart configurations against renderAt component. The output for multiple chart exports will resemble the snapshot below:
Customize the layout dynamically
Being the end-user, you can go ahead and add more UI elements like full width charts, headers etc and customize the layout as per requirements.
Let’s build the template for the exported PDF inclusive of a full width map and the header along with all the other charts.
Insert code here
<style>
Insert stylesheet here
</style>
</head>
<body>
<div class="dashboard-container">
<div class="dashboard-row">
<div class="intro-block">
<h1>Wealth Management</h1>
<p class="mt-0">
<%= headerText %>
</p>
<hr>
</div>
</div>
<div class="dashboard-row">
<div class="chart">
<div class="chart-block">
<div class="pri-chart" id="chart-container-map"></div>
</div>
</div>
<div class="chart">
<div class="chart-block">
<div class="sec-chart" id="chart-container-top-adv"></div>
</div>
</div>
...
</body>
</html>If you’ve followed the above steps till now you should have a functional dashboard with export functionality in an executable format. Take a look at the live dashboard here.
Anytime you get stuck or for any references, check out the source code from this GitHub Repository.
Exporting dashboards from other charting libraries like D3.js, HighCharts, Charts.js etc
FusionExport enables you to download live HighCharts dashboards, D3.js dashboards (and not just individual charts), keeping the layout intact. Hence, dynamically adding live elements like logo, data tables, and grids have become super easy now. With a single click, you can make it a downloadable report as well. Go ahead and explore a whole new level of visualising data and building dashboards.
Also, take a look at “How to export dashboards from D3.js and HighCharts” build by their in-house developers.
Hope this tutorial helped you export the dashboard using FusionExport. With FusionExport, you can now go ahead and create more charts and visualisations without any hassle of export functionality.
You can download FusionExport for any tech stack from here: Sign up for FusionExport
Before we part ways, you can take a look at our live dashboards such as Online Retail Dashboard, Technology Dashboard, and Web-Series Dashboard to see the power of FusionCharts as well as FusionExport.