If you’re looking for the best Vue chart library for interactive data visualization, there isn’t a one-size-fits-all answer. The right choice depends on your project’s requirements.
FusionCharts is well suited for enterprise dashboards and advanced visualizations. Chart.js is a great choice for lightweight charts. Apache ECharts excels at data-intensive dashboards. ApexCharts offers a developer-friendly experience for modern web applications. Highcharts is widely used for commercial applications, while D3.js provides unmatched flexibility for fully customized data visualizations.
Vue powers modern dashboards, SaaS platforms, business intelligence tools, financial applications, and other data-driven web applications. Choosing the right charting library improves user experience, simplifies development, supports real-time data visualization, and scales with your application’s growing needs.
This guide compares the leading Vue chart libraries based on performance, features, Vue 3 compatibility, pricing, real-time capabilities, licensing, and enterprise readiness to help you choose the best Vue chart library for interactive data visualization in 2026.
Table of Contents
TL;DR
If you’re looking for the best Vue chart library for interactive data visualization, the right choice depends on your project’s requirements. Here’s a quick comparison of the leading options based on common development needs.
| Use Case | Recommended Library | Why It Stands Out |
|---|---|---|
| Best for Enterprise & Advanced Visualizations | FusionCharts | Offers 100+ chart types, 1,400+ maps, Gantt charts, real-time updates, and enterprise-grade support. |
| Best Free | Chart.js | Lightweight, open source, and easy to integrate for common chart types. |
| Best Open Source | Apache ECharts | Rich visualizations, strong performance, and excellent support for large datasets and real-time dashboards. |
| Best for Modern Dashboards | ApexCharts | Developer-friendly API with polished interactive charts, built-in zooming, and responsive layouts. |
| Best for Commercial Business Applications | Highcharts | Mature charting library with extensive chart types and commercial support. |
| Best for Custom Visualizations | D3.js | Complete flexibility for building highly customized and interactive data visualizations. |
Bottom line: Choose FusionCharts if you need enterprise-ready dashboards with advanced charts, maps, Gantt charts, and real-time data visualization. For lightweight or open-source projects, Chart.js and Apache ECharts are excellent alternatives, while ApexCharts, Highcharts, and D3.js are strong choices for specific use cases.
What Is a Vue Chart Library?
A Vue chart library is a JavaScript library that helps developers create interactive charts and data visualizations in Vue applications without building them from scratch. Most libraries provide reusable Vue components or wrappers that integrate with Vue, allowing charts to automatically update as application data changes.
Instead of manually drawing charts with HTML, SVG, or Canvas APIs, developers simply install a charting library, pass in their data and configuration, and let the library handle rendering, animations, and updates. This makes Vue chart libraries ideal for dashboards, business intelligence tools, SaaS platforms, financial applications, and other data-driven web applications.
How Vue Chart Libraries Work
Most charting libraries provide an official or community-supported Vue wrapper that connects the core JavaScript charting engine to Vue components. For example, vue-chartjs wraps Chart.js, vue-echarts integrates Apache ECharts, and vue-apexcharts connects ApexCharts with Vue. Developers import the component, configure the chart, and Vue’s reactivity automatically keeps it in sync with changing data.
SVG vs. Canvas Rendering
Most Vue chart libraries render charts using SVG (Scalable Vector Graphics), HTML5 Canvas, or both.
- SVG creates individual DOM elements, making it ideal for responsive, interactive charts with fewer data points. It also provides better accessibility and easier CSS styling.
- Canvas renders graphics on a bitmap surface, making it better suited for large datasets, complex animations, and high-performance visualizations. However, individual chart elements are less accessible for styling and interaction.
The rendering technology varies by library and use case, with some libraries supporting both approaches.
What Chart Types Do Vue Chart Libraries Support?
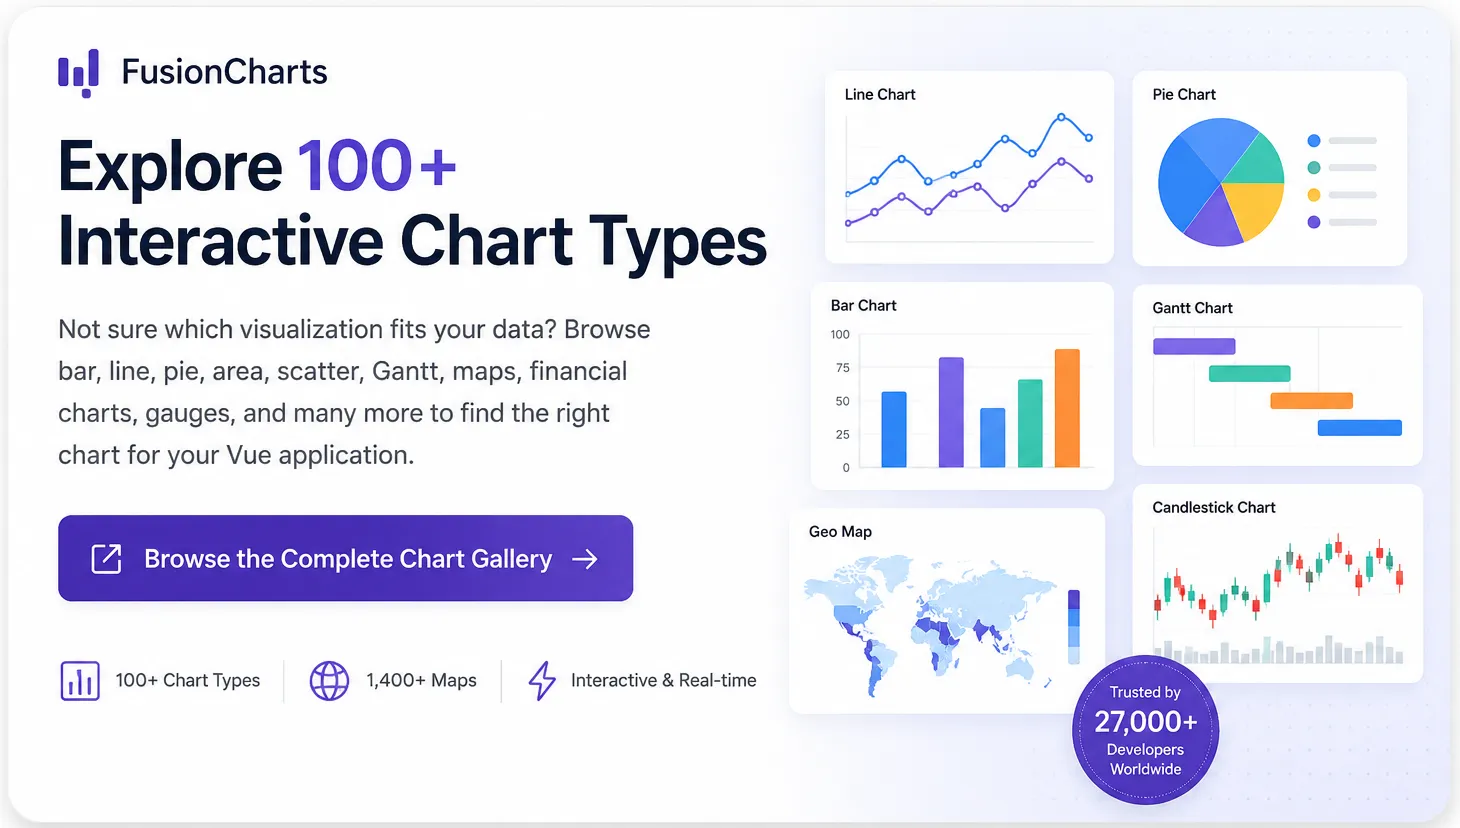
Modern Vue chart libraries support a wide variety of chart types for dashboards, business intelligence, financial reporting, and data visualization applications. The most common chart types include:
- Bar charts – Compare values across categories.
- Line charts – Visualize trends over time.
- Area charts – Highlight cumulative values and trends.
- Pie and doughnut charts – Show proportions within a dataset.
- Scatter and bubble charts – Explore relationships between variables.
- Heatmaps – Identify patterns and data density.
- Treemaps – Display hierarchical data.
- Radar charts – Compare multiple metrics across categories.
- Stock and time-series charts – Analyze financial and time-based data.
- Gantt charts – Plan and track projects and timelines.
- Geographic maps – Visualize location-based data.
Not every Vue chart library supports all of these chart types. Lightweight libraries typically focus on standard charts, while enterprise solutions often include specialized visualizations such as Gantt charts, maps, financial charts, gauges, and real-time dashboards. Before choosing a library, consider the chart types your application requires today and those you may need as it grows.
Why Use a Vue Chart Library Instead of Building Charts from Scratch?
Building charts from scratch with SVG or Canvas gives you complete control, but it also requires significant development and ongoing maintenance. A Vue chart library provides ready-to-use components, interactive features, and responsive visualizations, allowing developers to build dashboards and data-driven applications faster.
Here are the main advantages of using a Vue chart library:
Faster Development
Most Vue chart libraries include prebuilt components for common chart types such as bar, line, pie, area, and scatter. You simply provide your data and configuration, reducing development time and accelerating project delivery.
Easier Maintenance
Maintaining a custom charting solution becomes increasingly complex as your application grows. Established chart libraries receive regular updates, bug fixes, browser compatibility improvements, and new features, reducing long-term maintenance effort.
Built-in Accessibility
Many libraries include accessibility features such as keyboard navigation, screen reader support, and customizable color schemes, helping developers build more inclusive applications with less effort.
Responsive Performance
Modern Vue chart libraries automatically adapt to different screen sizes and optimize rendering using SVG, Canvas, or both. This helps maintain smooth performance across desktops, tablets, and mobile devices.
Rich Interactivity
Interactive features such as animations, zooming, panning, drill-down, tooltips, legends, and real-time updates are often available out of the box. Implementing these capabilities from scratch typically requires considerable development time.
For most dashboards, analytics platforms, and enterprise applications, using a mature Vue chart library is faster, easier to maintain, and more cost-effective than building a custom charting solution.
How We Evaluated the Best Vue Chart Libraries
There isn’t a single best Vue chart library for every project. Some libraries are designed for lightweight visualizations, while others focus on enterprise dashboards, real-time analytics, or highly customized charts. To provide a balanced comparison, we evaluated each library using the same set of criteria.
- Vue Support: Availability of official or community-supported Vue components and ease of integration.
- Vue 3 Compatibility: Support for the latest Vue features, including the Composition API and Single File Components (SFCs).
- TypeScript Support: Quality of type definitions and developer experience when building TypeScript applications.
- Performance: Rendering speed, scalability, and efficient handling of large datasets.
- Reactivity: How well charts update in response to changes in Vue’s reactive data model.
- Documentation: Clarity, completeness, tutorials, examples, and API references.
- Bundle Size: Overall package size and its impact on application performance.
- Accessibility: Support for keyboard navigation, screen readers, and accessible data visualizations.
- Licensing: Open-source availability, commercial licensing options, and usage restrictions.
- Commercial Use: Suitability for SaaS products, customer-facing applications, and commercial deployments.
- Enterprise Support: Availability of professional support, long-term maintenance, and enterprise-ready features.
- Community & Maintenance: Community adoption, release frequency, issue resolution, and long-term project health.
Rather than ranking libraries based on a single feature, this guide evaluates how well each one meets the needs of different projects, from lightweight dashboards to enterprise-grade data visualization platforms.
Which Is the Best Vue Chart Library for Interactive Data Visualization?
The best Vue chart library for interactive data visualization depends on your project’s requirements. The comparison below evaluates the leading Vue chart libraries based on Vue integration, features, performance, licensing, documentation, and enterprise readiness to help you choose the right solution.
1. FusionCharts
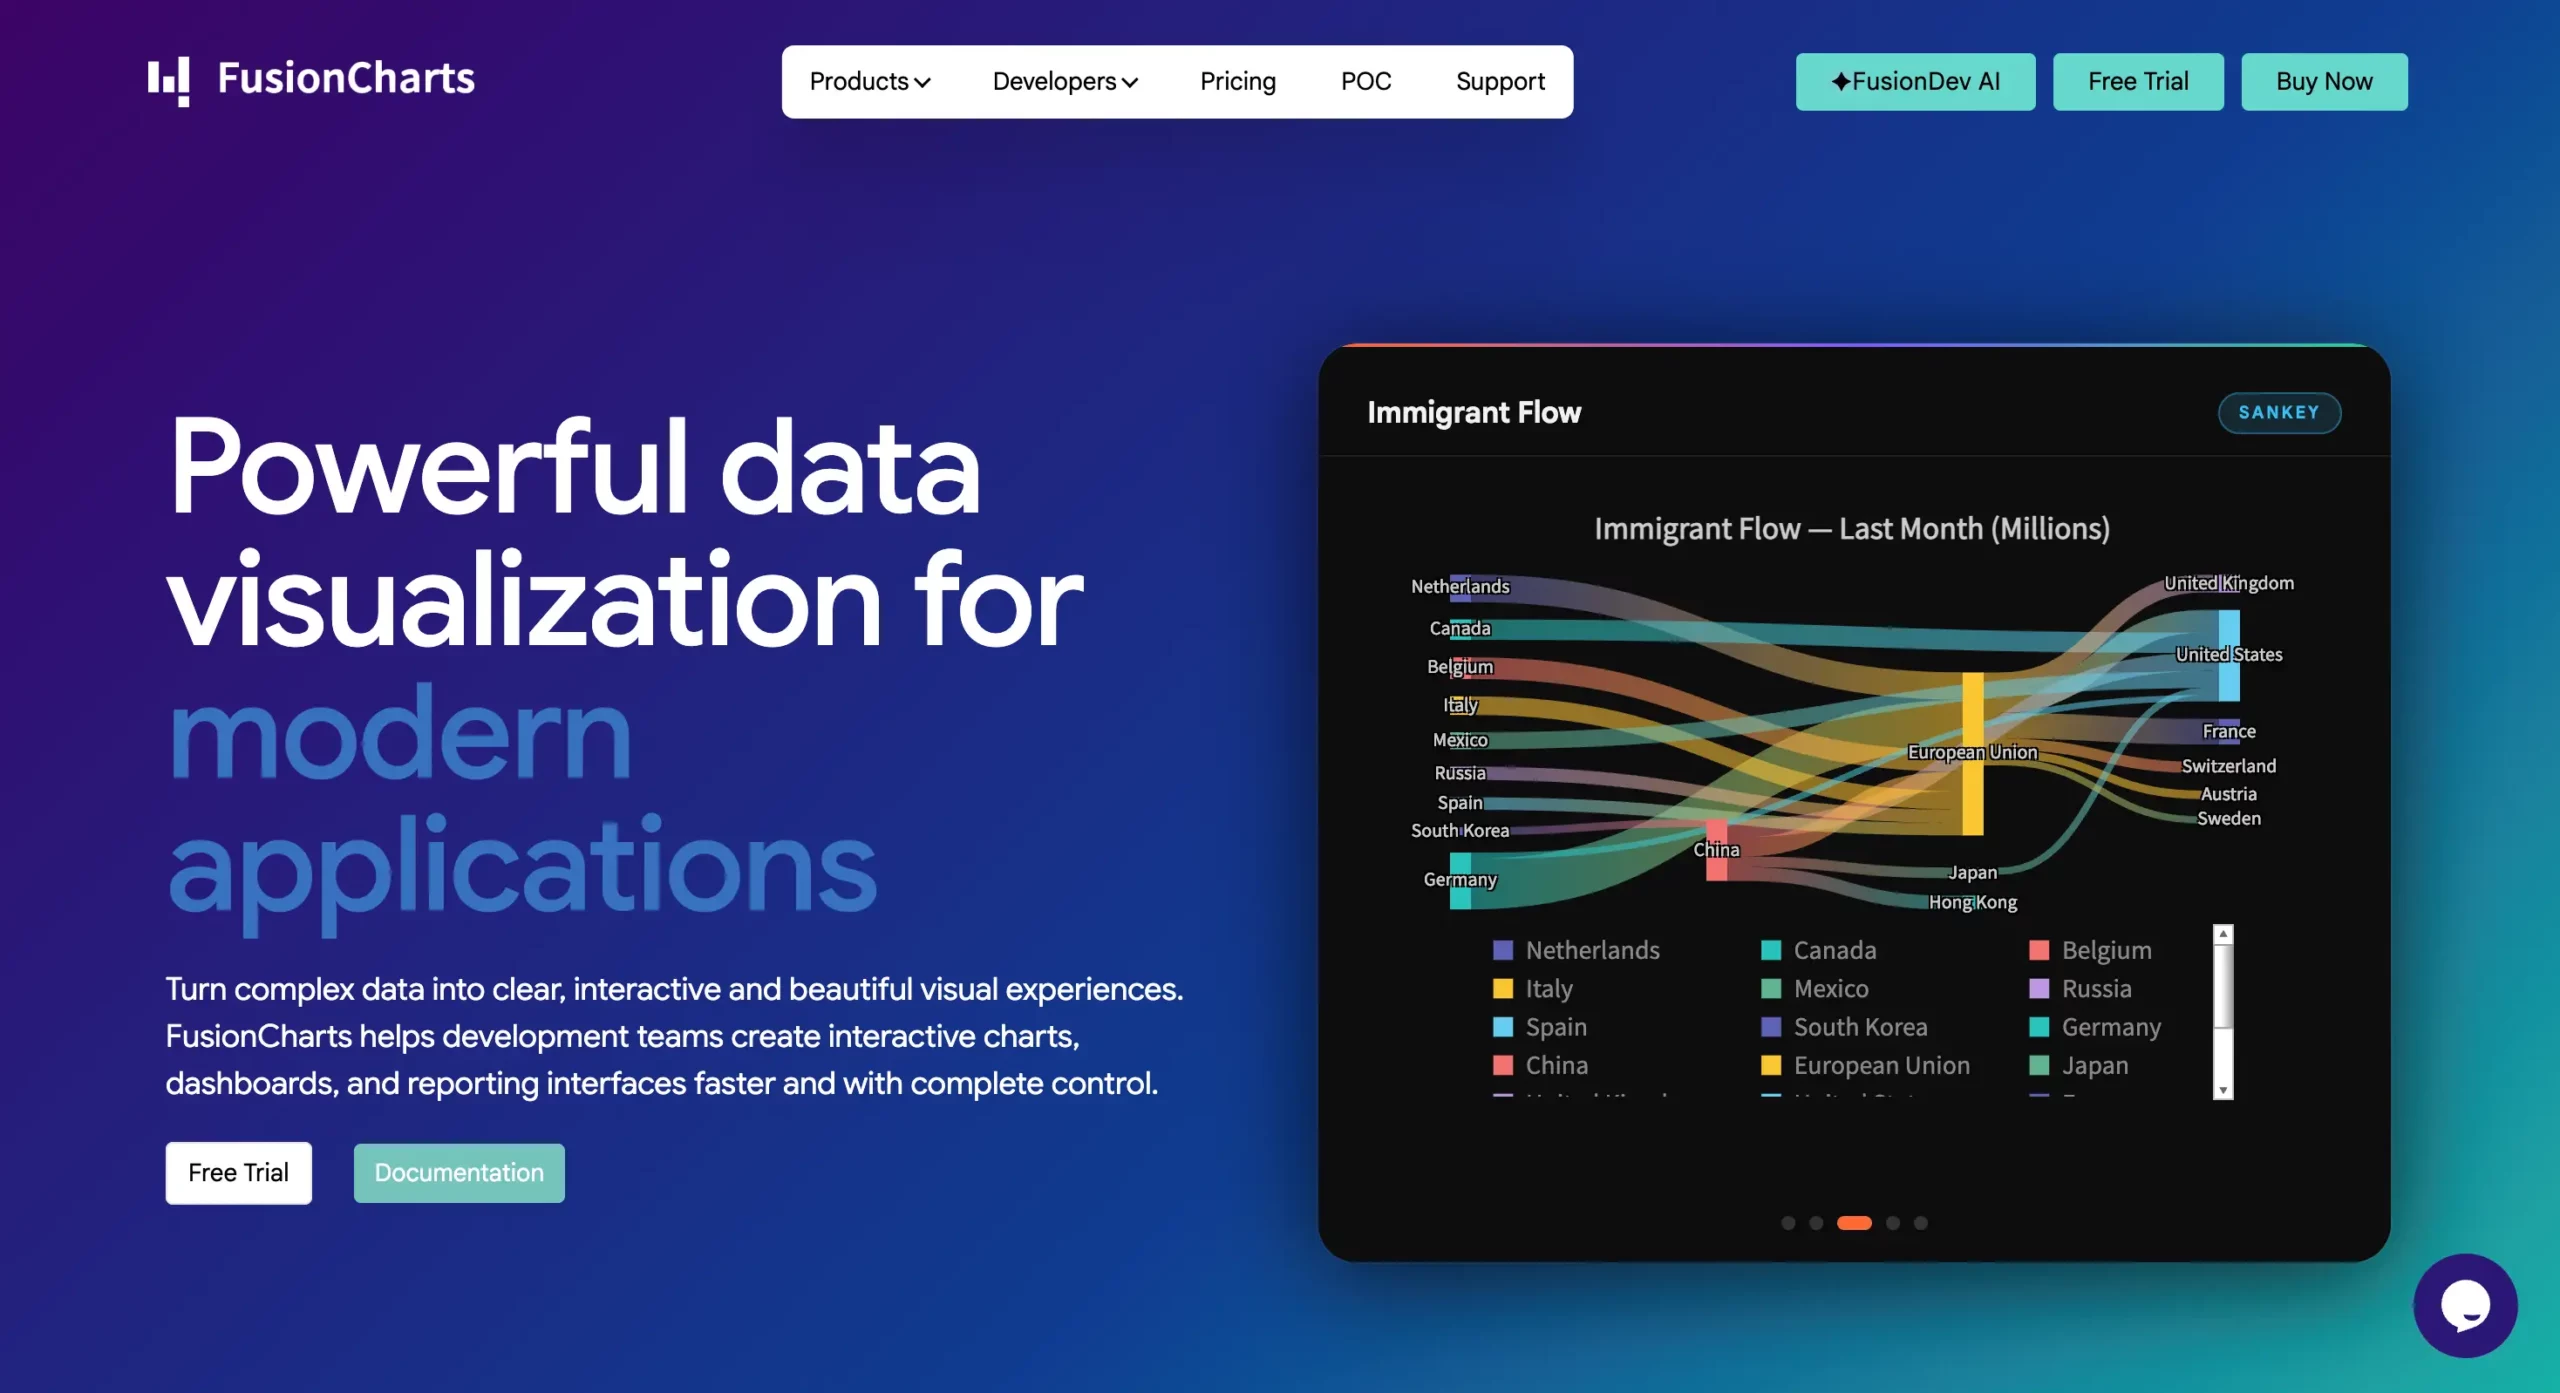
FusionCharts is a commercial JavaScript charting library designed for building interactive dashboards, business intelligence platforms, enterprise applications, and data-rich web applications. It offers more than 100 chart types, 1,400+ interactive maps, Gantt charts, financial charts, and built-in support for real-time data visualization. FusionCharts is one of the most comprehensive charting solutions for Vue developers.
Unlike many chart libraries that focus primarily on standard charts, FusionCharts includes specialized visualizations such as heatmaps, treemaps, gauges, funnel charts, maps, and Gantt charts without requiring additional libraries or plugins. It also provides extensive documentation, responsive rendering, accessibility features, export capabilities, and long-term commercial support.
Pros
- Supports 100+ chart types for a wide range of business and analytical use cases.
- Includes 1,400+ interactive maps and built-in Gantt charts.
- Supports real-time data visualization and live dashboards.
- Responsive, accessible, and optimized for desktop and mobile devices.
- Comprehensive documentation with framework-specific guides and examples.
- Commercial support and regular updates for enterprise applications.
Cons
- Commercial licensing is required for production use beyond the free trial.
- Bundle size is larger than lightweight libraries designed for basic charting needs.
- May provide more features than necessary for simple visualization projects.
Vue Integration
FusionCharts provides an official Vue wrapper that integrates seamlessly with Vue applications. Developers can quickly create charts by installing the Vue package, importing the required components, and binding reactive data to the chart configuration. The library supports Vue 3, works well with Vue’s reactive data model, and includes examples for common dashboard and analytics scenarios.
Explore how to create charts in Vue using FusionCharts.
Pricing
FusionCharts is a commercial charting library with multiple licensing options for developers, teams, and enterprises. A free trial is available for evaluation before purchasing a license.
Best For
FusionCharts is best suited for:
- Enterprise dashboards
- Business intelligence platforms
- SaaS analytics applications
- Financial reporting systems
- Applications requiring maps, Gantt charts, or real-time dashboards
- Organizations that require commercial support and long-term maintenance
2. Chart.js
Chart.js is one of the most popular open-source JavaScript charting libraries for creating responsive and interactive charts. Known for its lightweight design and simple API, it supports common chart types such as bar, line, pie, doughnut, radar, scatter, and bubble charts. For Vue applications, developers typically use the vue-chartjs wrapper, which integrates Chart.js with Vue’s reactive component model.
Chart.js is an excellent choice for projects that require straightforward data visualizations without the complexity of enterprise-grade charting features. While it offers plugins for extending functionality, advanced visualizations such as Gantt charts, interactive maps, and specialized business charts require third-party solutions or custom development.
Pros
- Free and open source under the MIT license.
- Lightweight with a simple, developer-friendly API.
- Integrates easily with Vue through the vue-chartjs wrapper.
- Responsive by default with built-in animations and interactive tooltips.
- Large community, extensive documentation, and an active plugin ecosystem.
Cons
- Supports fewer chart types than enterprise charting libraries.
- Does not include built-in Gantt charts, geographic maps, or advanced business visualizations.
- Large or highly interactive dashboards may require additional performance optimization and plugins.
Vue Integration
Chart.js integrates with Vue using the official vue-chartjs wrapper, which supports Vue 3 and TypeScript. Charts automatically update as reactive data changes, making it straightforward to build dashboards and analytics applications using Vue’s Composition API and Single File Components (SFCs).
Learn more about Vue-Chart.js integration.
Pricing
Chart.js is free and open source under the MIT license, making it suitable for both personal and commercial projects without licensing fees.
Best For
Chart.js is best suited for:
- Small to medium-sized Vue applications
- Business dashboards with standard chart types
- SaaS products requiring lightweight visualizations
- Educational and open-source projects
- Developers looking for a simple, well-documented charting library
3. Apache ECharts
Apache ECharts is a powerful open-source JavaScript charting library maintained by the Apache Software Foundation. It is designed for building interactive data visualizations, business dashboards, and analytics applications. This Vue.js chart library supports a wide range of chart types, including line, bar, pie, scatter, heatmap, treemap, radar, graph, Sankey, and geographic maps.
This library is known for its strong rendering performance and extensive customization options. Due to these features, Apache ECharts is well suited for applications that need to visualize large datasets or display complex, interactive charts. Vue developers can integrate it using the official vue-echarts wrapper, which works seamlessly with Vue’s reactive data model and Vue 3.
Pros
- Free and open source under the Apache 2.0 License.
- Supports a wide variety of chart types, including maps, heatmaps, treemaps, and Sankey diagrams.
- Excellent performance for large datasets through Canvas rendering, with SVG support available when needed.
- Highly customizable with built-in animations, zooming, panning, and interactive features.
- Official Vue integration through vue-echarts with Vue 3 and TypeScript support.
Cons
- Steeper learning curve than simpler libraries such as Chart.js.
- Advanced configuration options can increase development complexity.
- Does not provide built-in Gantt charts, requiring third-party solutions or custom implementations.
Vue Integration
Apache ECharts integrates with Vue via the official vue-echarts wrapper, enabling developers to build reactive charts with Vue components. It supports Vue 3, the Composition API, and TypeScript, making it a strong choice for modern Vue applications that require responsive and data-intensive visualizations.
Learn more about Vue-ECharts integration.
Pricing
Apache ECharts is free and open source under the Apache License 2.0, allowing both personal and commercial use without licensing fees.
Best For
Apache ECharts is best suited for:
- Interactive business dashboards
- Data-intensive web applications
- Business intelligence and analytics platforms
- Applications that visualize large datasets
- Open-source and commercial projects requiring advanced chart types
- Developers who need extensive customization without commercial licensing costs
4. Highcharts
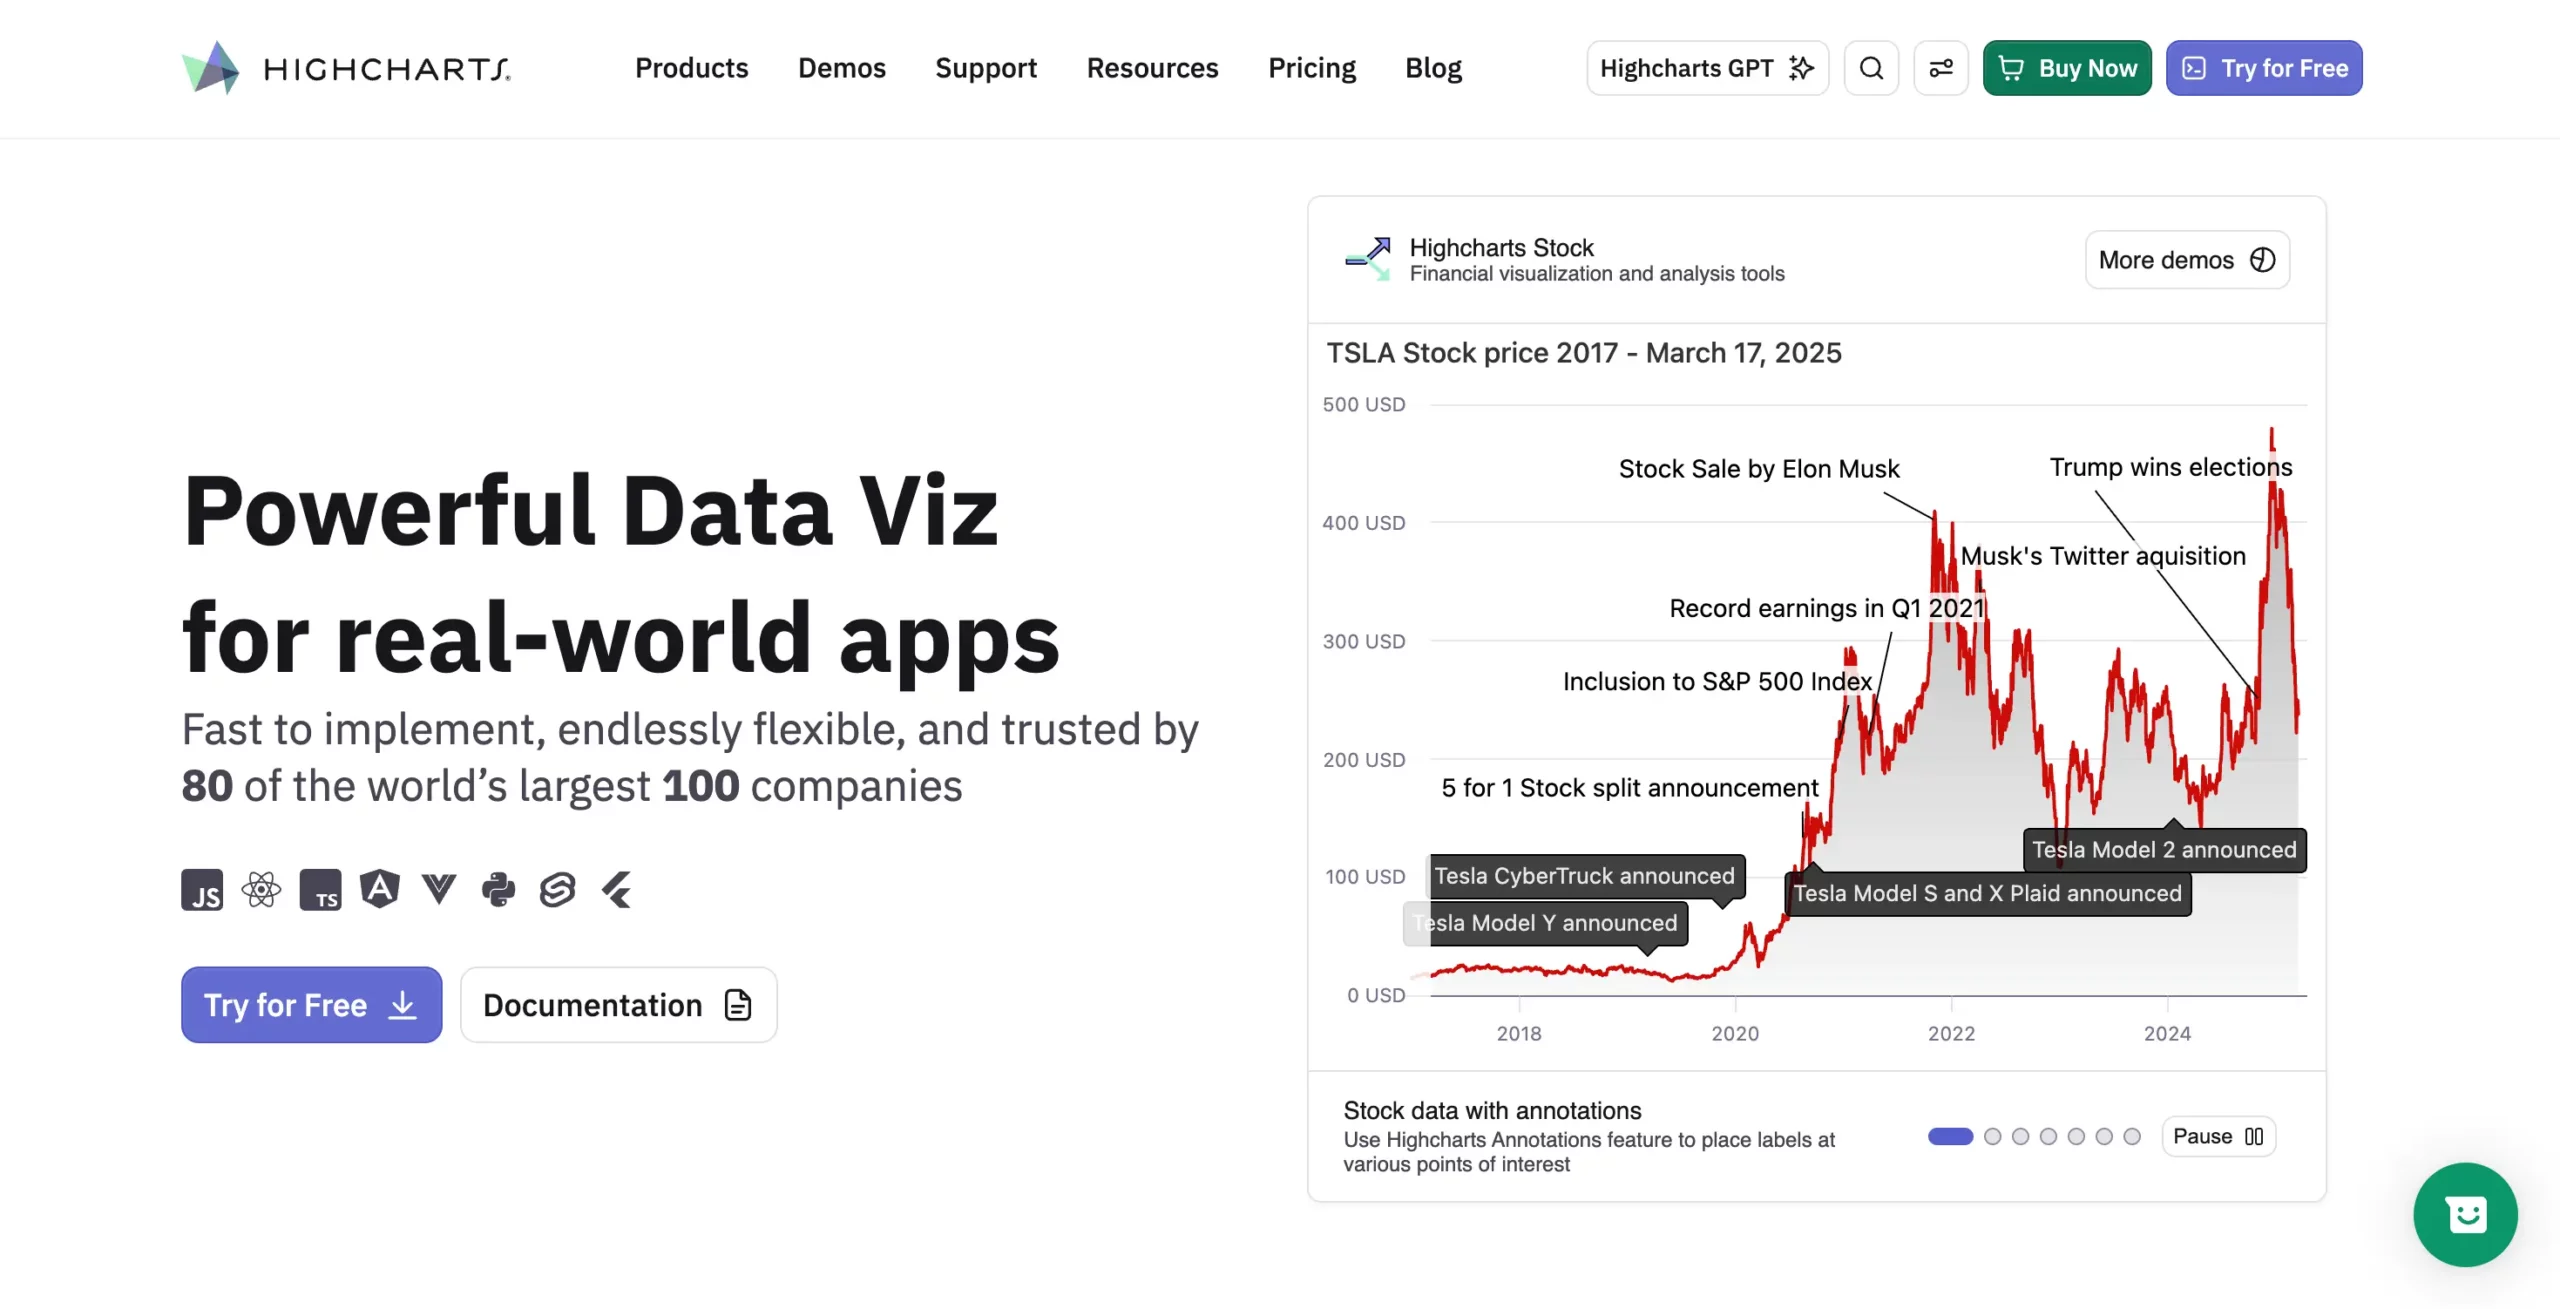
Highcharts is a commercial JavaScript charting library widely used for building interactive charts, dashboards, reporting systems, and business intelligence applications. It offers a comprehensive collection of chart types, including bar, line, area, pie, scatter, bubble, stock, maps, Gantt, and network charts. This makes it suitable for a broad range of data visualization projects.
This JavaScript Library is known for its polished visualizations, extensive API, and strong documentation. Highcharts is a popular choice for commercial web applications that require professional-grade charts and long-term reliability. Vue developers can integrate Highcharts using the official highcharts-vue wrapper, which supports Vue’s reactive data model and modern development workflows.
Pros
- Supports a wide variety of chart types, including Stock Charts, Maps, and Gantt Charts.
- Official Vue integration through highcharts-vue.
- Highly customizable with rich interactivity, animations, and responsive layouts.
- Comprehensive documentation and a mature developer ecosystem.
- Strong accessibility features, including keyboard navigation and screen reader support.
Cons
- Commercial licensing is required for most business and production applications.
- Some advanced capabilities, such as Stock Charts, Maps, and Gantt Charts, are provided as separate modules.
- The extensive API may require additional learning for developers building simple dashboards.
Vue Integration
Highcharts integrates with Vue through the official highcharts-vue wrapper, making it easy to build reactive charts in Vue 3 applications. Developers can bind Vue data directly to chart configurations, allowing visualizations to update automatically as application data changes. The library also supports TypeScript and works well with Vue’s Composition API.
Explore more about Highcharts Vue integration.
Pricing
Highcharts is a commercial charting library. While it can be evaluated using a free trial, production use requires a commercial license. Pricing varies based on the number of developers, deployment type, and optional products such as Highcharts Stock, Highcharts Maps, and Highcharts Gantt.
Best For
Highcharts is best suited for:
- Commercial business applications
- Financial reporting and stock market dashboards
- Enterprise reporting systems
- Interactive analytics dashboards
- Applications requiring polished, highly customizable visualizations
- Organizations seeking commercial support and long-term product maintenance
5. ApexCharts
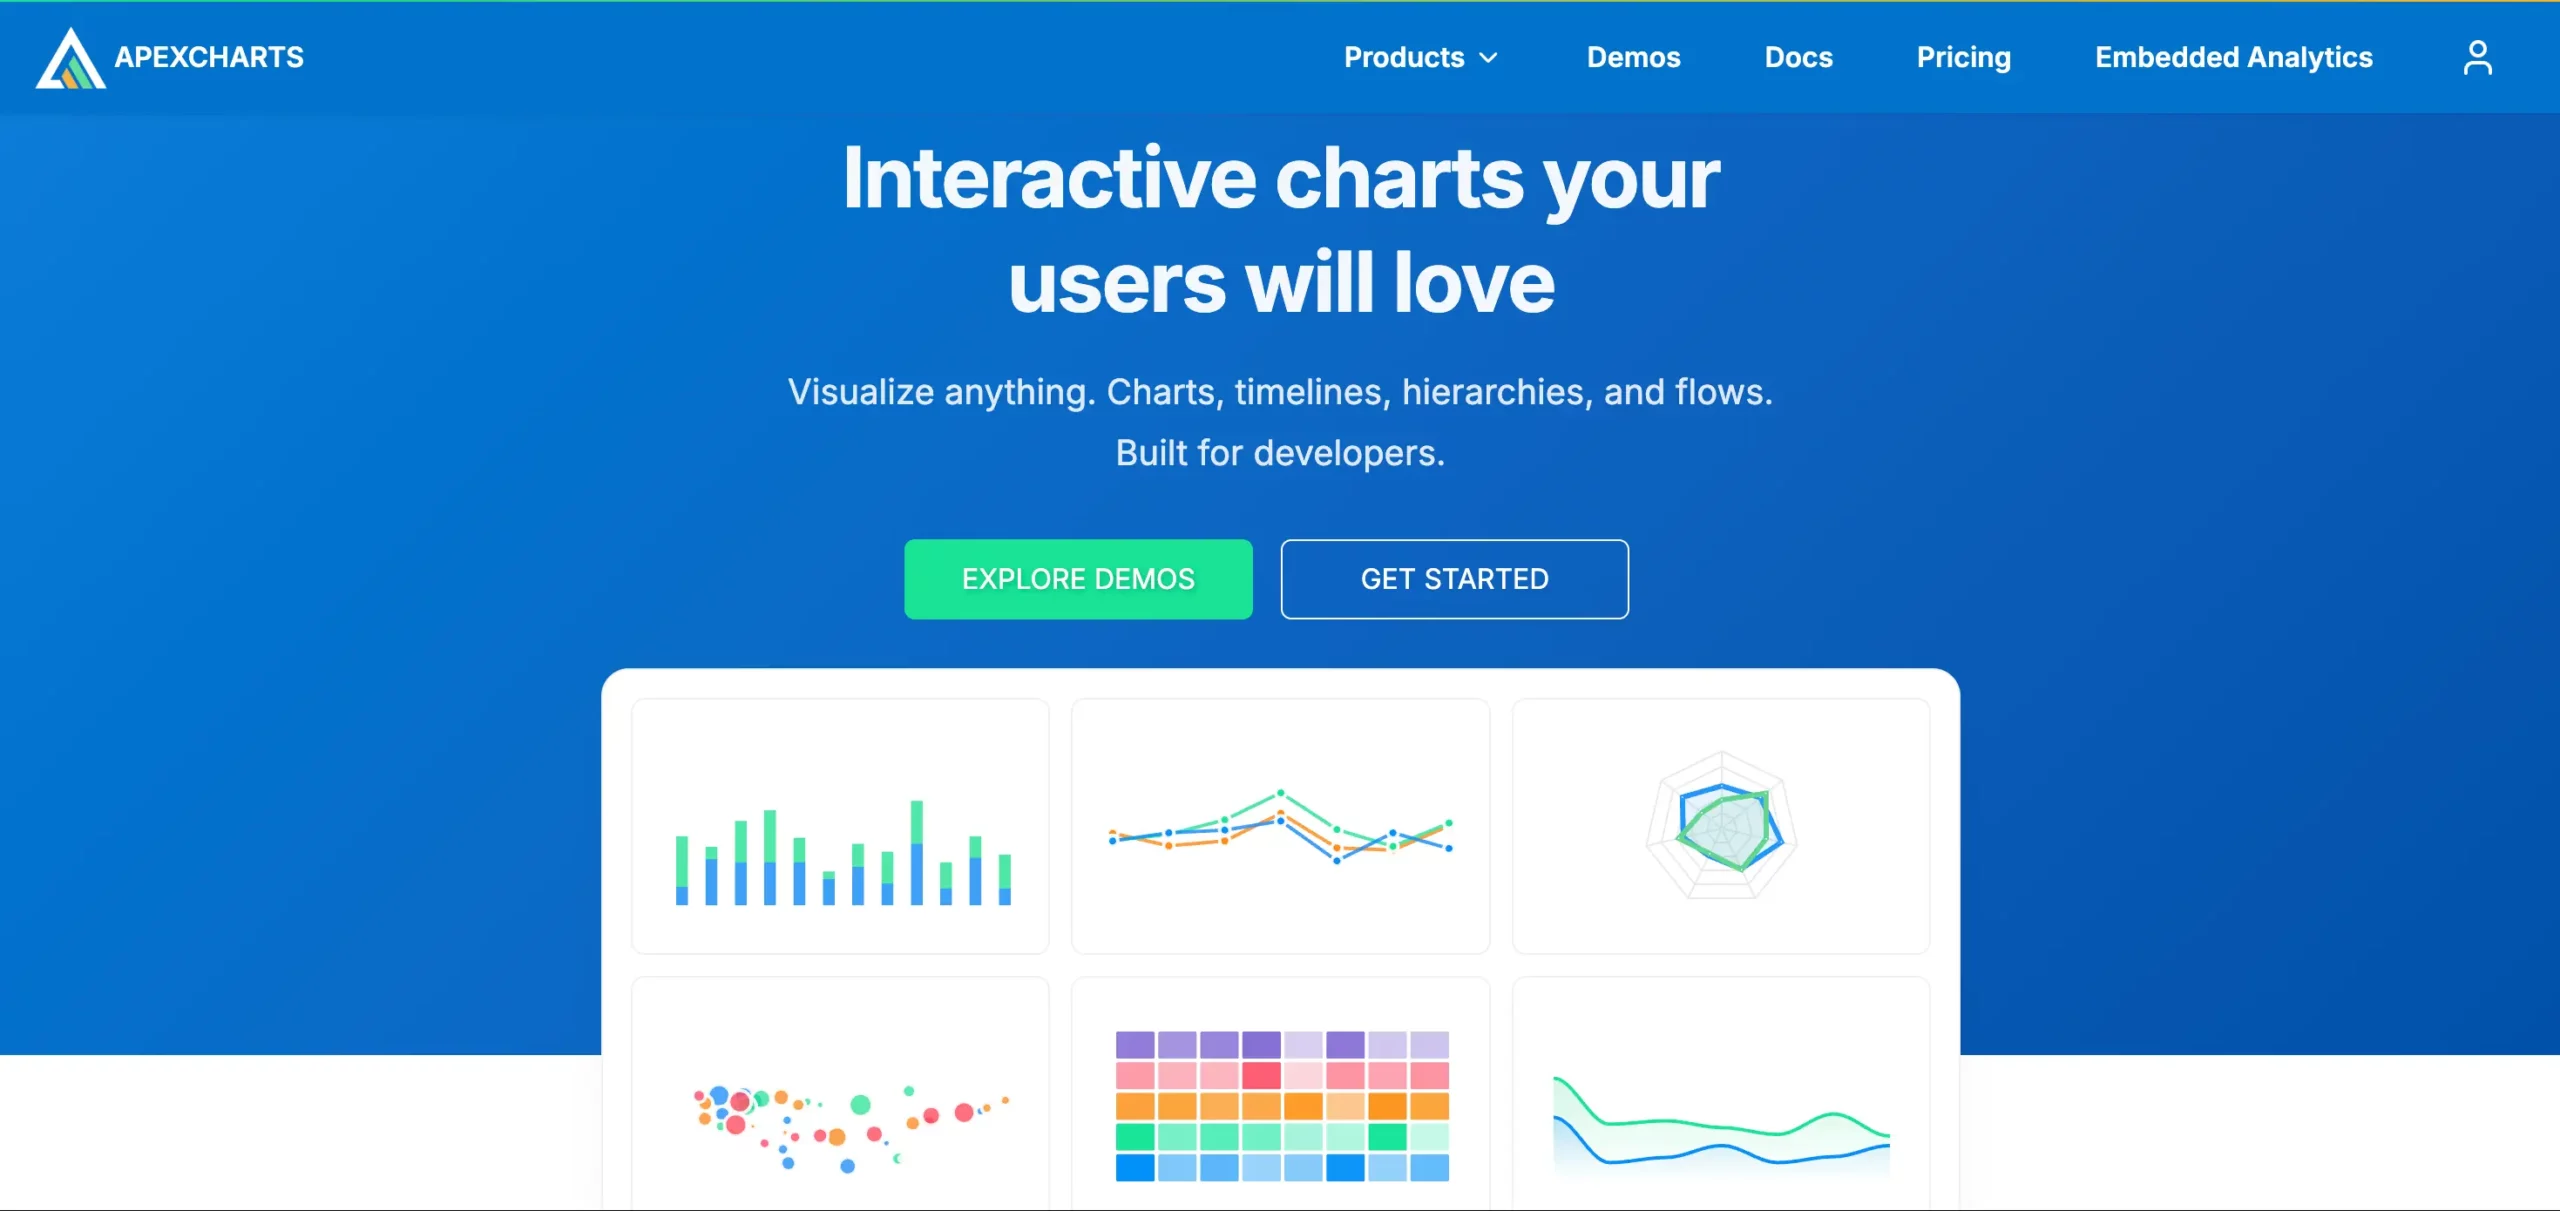
ApexCharts is a modern JavaScript charting library designed to build responsive, interactive charts with minimal configuration. It supports a wide range of chart types, including line, bar, area, pie, radar, heatmap, candlestick, treemap, radial bar, and mixed charts. Vue developers can integrate the library using the official vue3-apexcharts wrapper for Vue 3 applications.
ApexCharts is particularly popular for SaaS products, administrative dashboards, and business applications because of its clean API, attractive default styling, and built-in interactive features. While it offers fewer specialized visualizations than some enterprise charting libraries, it provides an excellent balance of functionality, ease of use, and performance for many web applications.
Pros
- Easy to learn with a clean, developer-friendly API.
- Official Vue integration through vue3-apexcharts.
- Responsive by default with modern-looking charts.
- Includes built-in interactivity such as zooming, panning, tooltips, and synchronized charts.
- Supports a wide variety of chart types, including financial and mixed charts.
- Works well with Vue 3 and TypeScript.
Cons
- Does not include built-in geographic maps or Gantt charts.
- Offers fewer specialized enterprise visualizations than libraries such as FusionCharts.
- Commercial licensing may be required depending on your project’s use and deployment.
Vue Integration
ApexCharts integrates with Vue through the official vue3-apexcharts wrapper, making it simple to create reactive charts using Vue components. Charts automatically update when reactive data changes, and the library works seamlessly with Vue 3, the Composition API, and TypeScript.
Explore more about Vue-ApexCharts integration.
Pricing
ApexCharts provides free and commercial licensing options, with licensing requirements depending on how the library is used. Developers should review the latest licensing terms before using it in commercial or production applications.
Best For
ApexCharts is best suited for:
- Modern SaaS applications
- Business dashboards
- Administrative portals
- Startup and small-to-medium web applications
- Developers looking for attractive, interactive charts with minimal configuration
6. D3.js
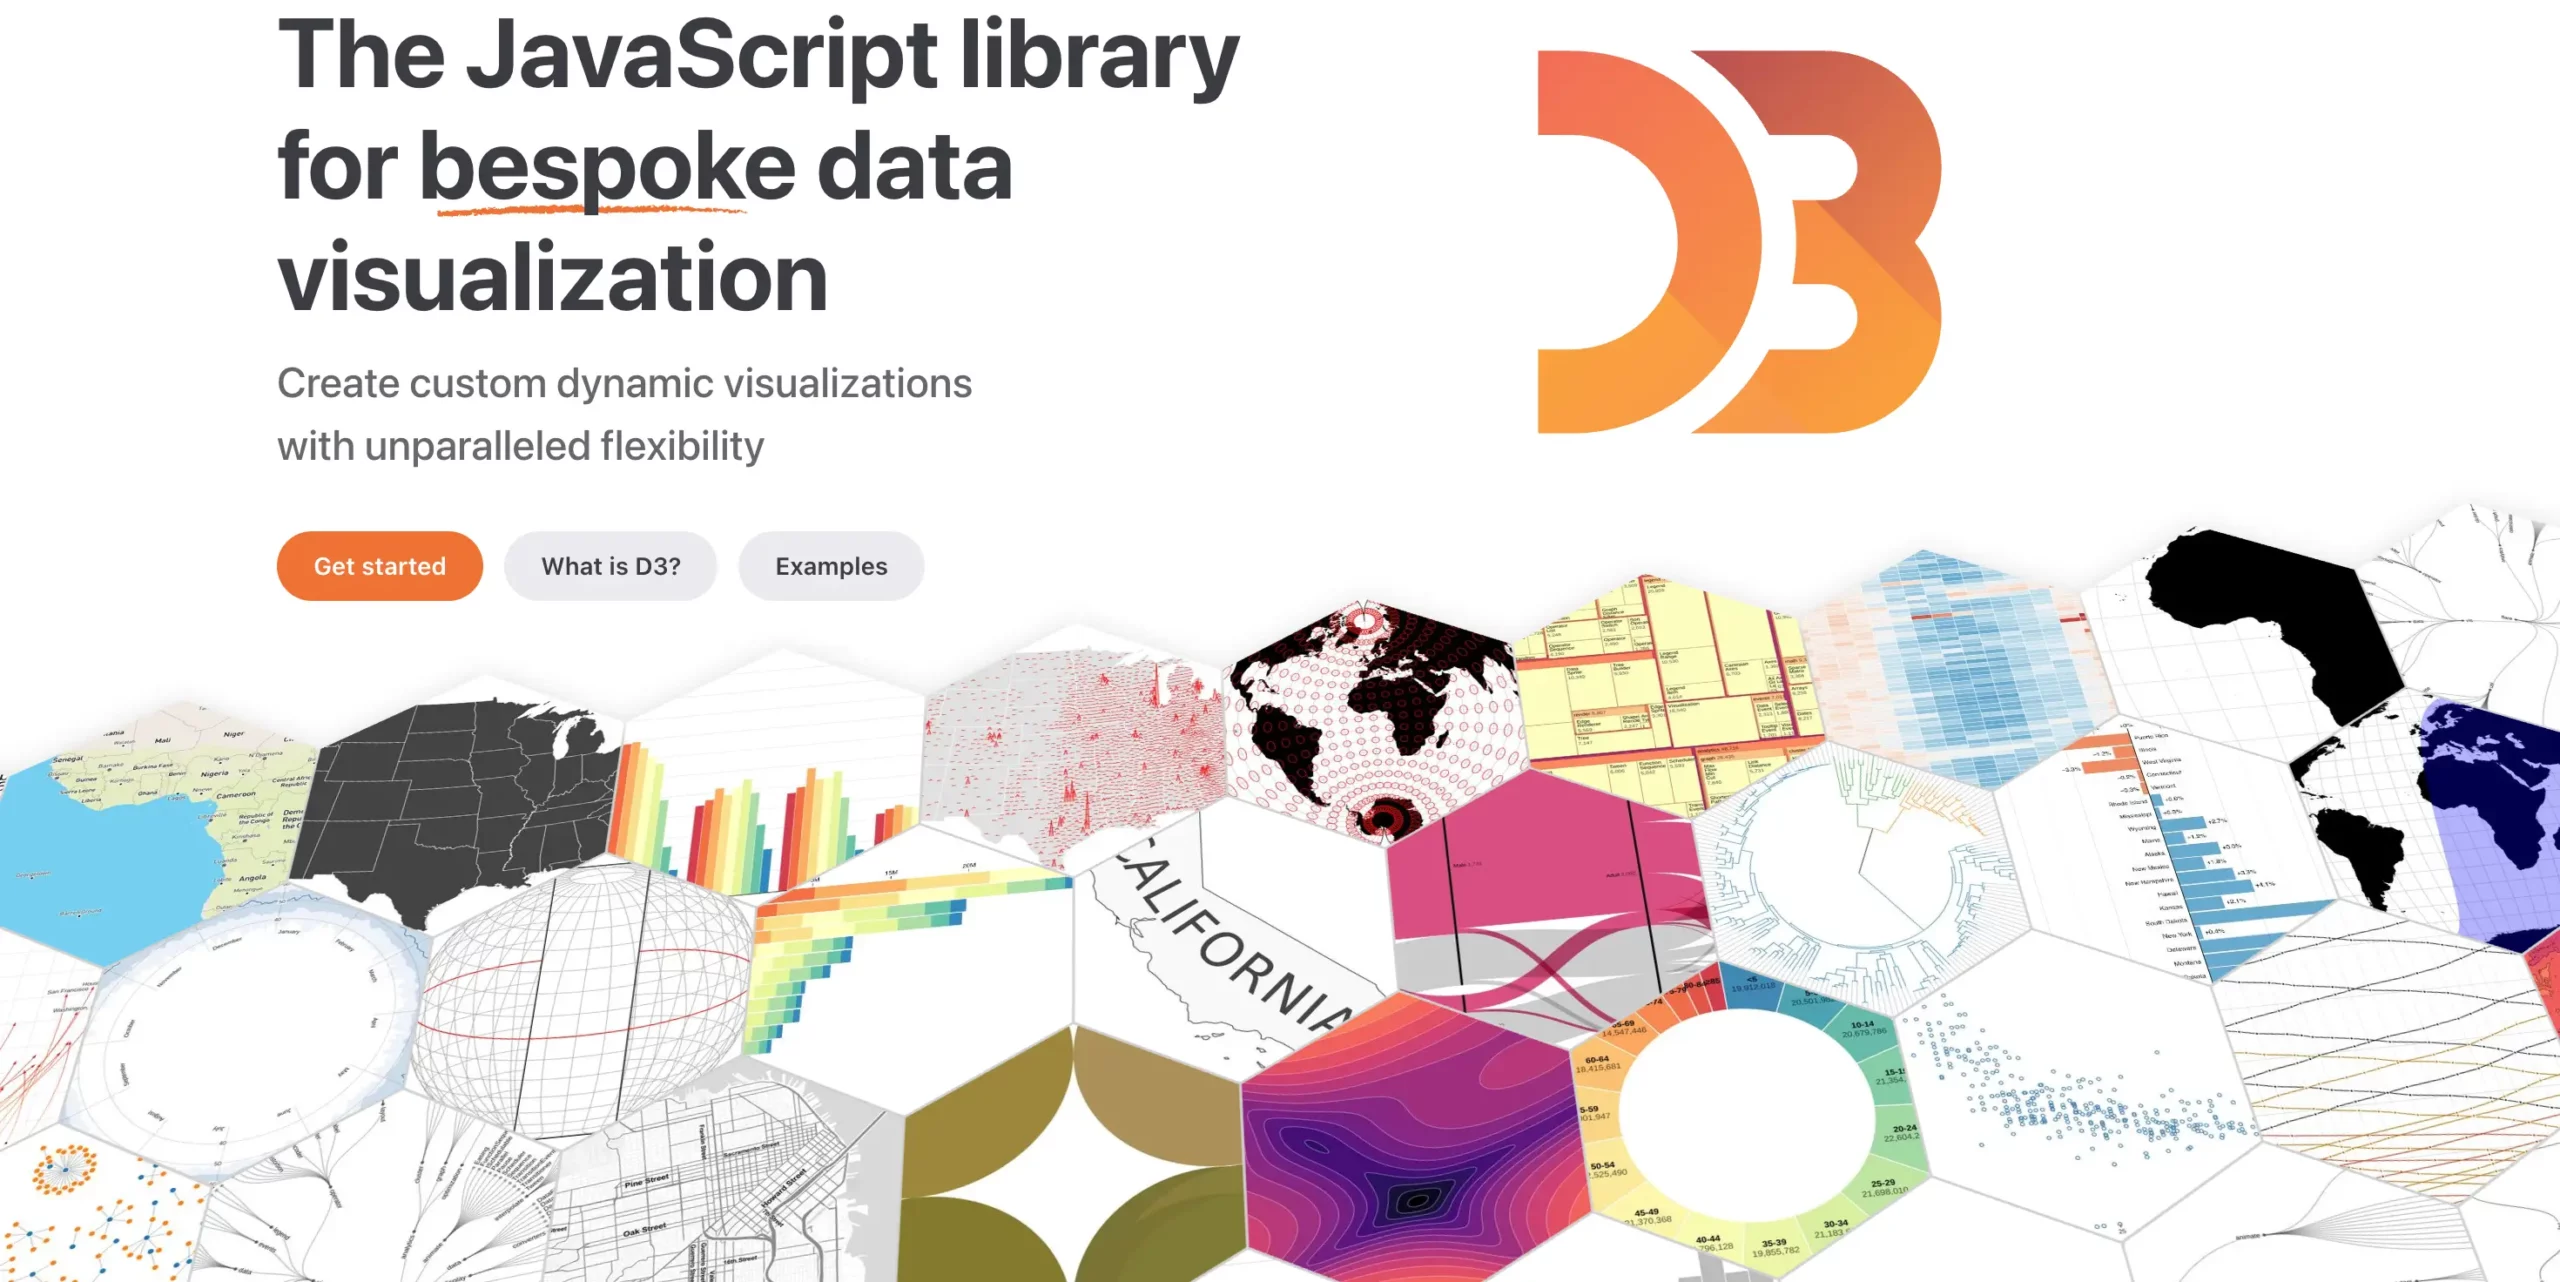
D3.js (Data-Driven Documents) is an open-source JavaScript library for creating highly customized and interactive data visualizations. Unlike traditional charting libraries that provide pre-built chart components, D3.js gives developers complete control over how data is rendered using web standards such as SVG, Canvas, and HTML.
This flexibility makes D3.js one of the most powerful data visualization libraries available. Developers can build everything from standard charts to complex visualizations, animated graphics, network diagrams, geographic maps, and custom dashboards. However, because D3.js provides low-level visualization tools rather than ready-made charts, it has a steeper learning curve than most Vue chart libraries.
Pros
- Free and open source.
- Complete control over chart design, rendering, and interactions.
- Supports virtually any type of data visualization.
- Excellent for highly customized dashboards and storytelling visualizations.
- Large community with extensive learning resources and examples.
Cons
- Steeper learning curve than traditional charting libraries.
- No built-in chart components. Developers build visualizations from the ground up.
- Requires more development time and expertise for standard business charts.
- Vue integration requires additional implementation compared to dedicated Vue chart wrappers.
Vue Integration
Unlike libraries such as Chart.js or ApexCharts, D3.js does not provide an official Vue wrapper. Developers typically integrate D3.js directly into Vue components by combining Vue’s reactive data model with D3’s rendering and DOM manipulation capabilities. This approach offers maximum flexibility but requires a deeper understanding of both Vue and D3.js.
Pricing
D3.js is free and open source under the ISC License, making it suitable for personal, commercial, and enterprise projects without licensing fees.
Best For
D3.js is best suited for:
- Highly customized data visualizations
- Interactive storytelling and data journalism
- Scientific and research applications
- Network graphs and hierarchical visualizations
- Custom dashboards with unique visualization requirements
- Developers who need complete control over chart behavior and appearance
How Do the Best Vue Chart Libraries Compare?
Each Vue chart library has different strengths. Some prioritize lightweight performance and ease of use, while others focus on enterprise dashboards, advanced visualizations, or highly customized data experiences. The table below compares the most important features to help you quickly identify the libraries that best match your project requirements.
| Library | Chart Types | Real-time | Maps | Gantt | TypeScript | License | Best For |
|---|---|---|---|---|---|---|---|
| FusionCharts | 100+ | Yes | Yes | Yes | Yes | Commercial | Enterprise dashboards, business intelligence, advanced visualizations |
| Chart.js | Standard | Limited | No | No | Yes | MIT (Open Source) | Lightweight dashboards and common chart types |
| Apache ECharts | Extensive | Yes | Yes | No | Yes | Apache 2.0 | Open-source dashboards and large datasets |
| Highcharts | Extensive | Yes | Yes* | Yes* | Yes | Commercial | Financial reporting and commercial business applications |
| ApexCharts | Extensive | Yes | No | No | Yes | Free & Commercial | Modern SaaS dashboards and administrative portals |
| D3.js | Unlimited (Custom) | Custom | Custom | Custom | Yes | ISC (Open Source) | Highly customized data visualizations |
* Highcharts Maps and Highcharts Gantt are available as separate products/modules.
Which Vue Chart Library Performs Best?
Performance depends more on the library’s rendering engine than its Vue wrapper. Lightweight libraries load faster, while enterprise-focused solutions are optimized for real-time dashboards, advanced interactions, and large datasets.
| Library | Rendering | Large Datasets | Real-Time | Lazy Loading | Overall Performance |
|---|---|---|---|---|---|
| FusionCharts | SVG | Very Good | Excellent | Yes | ⭐⭐⭐⭐⭐ |
| Apache ECharts | Canvas (SVG optional) | Excellent | Excellent | Yes | ⭐⭐⭐⭐⭐ |
| Highcharts | SVG (Boost/WebGL) | Excellent | Excellent | Yes | ⭐⭐⭐⭐⭐ |
| ApexCharts | SVG | Good | Very Good | Yes | ⭐⭐⭐⭐☆ |
| Chart.js | Canvas | Very Good | Good | Yes | ⭐⭐⭐⭐☆ |
| D3.js | SVG / Canvas / WebGL | Excellent* | Custom | Custom | ⭐⭐⭐⭐⭐* |
*D3.js performance depends on your implementation and optimization.
Bundle Size
Smaller bundles improve initial load times. Chart.js and ApexCharts are among the lightest options, while FusionCharts, Highcharts, and Apache ECharts include more built-in features, resulting in larger bundles. D3.js is modular, letting you import only what you need.
Rendering Engine
- SVG (FusionCharts, Highcharts, ApexCharts) delivers crisp graphics, accessibility, and excellent interactivity.
- Canvas (Chart.js, Apache ECharts) performs better when rendering thousands of data points.
- WebGL acceleration is available through Highcharts Boost and custom D3.js implementations for extremely large datasets.
Large Datasets
For thousands of data points, Apache ECharts and Highcharts (Boost) provide the best out-of-the-box performance. Chart.js handles medium-to-large datasets well, while FusionCharts is optimized for enterprise dashboards. D3.js offers unlimited flexibility but requires manual optimization.
Lazy Loading
All major Vue chart libraries support lazy loading with dynamic imports, helping reduce your application’s initial bundle size.
const DashboardCharts = defineAsyncComponent(() =>
  import('./DashboardCharts.vue')
)
Real-Time Updates
FusionCharts, Apache ECharts, and Highcharts offer excellent APIs for streaming and live-updating data. ApexCharts and Chart.js also support frequent updates, while D3.js requires custom implementation.
A Real-Time Chart Created with a Vue Chart Library
Responsiveness
All libraries support responsive charts. FusionCharts, Highcharts, Apache ECharts, and ApexCharts automatically resize with minimal configuration, while Chart.js and D3.js may require additional customization depending on the use case.
Performance Verdict
- Best overall: FusionCharts, Apache ECharts, Highcharts
- Best for large datasets: Apache ECharts, Highcharts (Boost)
- Best lightweight library: Chart.js
- Best balance of features and performance: ApexCharts
- Best for custom visualizations: D3.js
For most commercial Vue applications, FusionCharts, Apache ECharts, and Highcharts offer the best balance of performance, scalability, and developer productivity.
Which Vue Chart Libraries Support Vue 3?
If you’re starting a new Vue project, choosing a library with first-class Vue 3 support is essential. Most popular charting libraries now work with Vue 3, but they differ in the quality of their Vue integration, TypeScript support, and long-term maintenance.
The table below compares the current state of Vue compatibility across the leading chart libraries.
| Library | Vue 2 | Vue 3 | Official Wrapper | TypeScript |
|---|---|---|---|---|
| FusionCharts | ✔️ | ✔️ | ✔️ | ✔️ |
| Highcharts | ✔️ | ✔️ | ✔️ | ✔️ |
| Apache ECharts | ✔️ | ✔️ | ✔️ | ✔️ |
| ApexCharts | ✔️ | ✔️ | ✔️ | ✔️ |
| Chart.js | ✔️ | ✔️ | ✔️ | ✔️ |
| D3.js | ✔️ | ✔️ | ❌ | ✔️ |
Composition API and SFCs
All of these libraries work well with Vue 3’s Composition API and Single File Components, making it easy to build reactive, reusable chart components.
Migrating from Vue 2
Most libraries provide dedicated Vue 3 wrappers, so upgrading typically involves updating the wrapper package and replacing deprecated Vue 2 APIs. Existing chart configurations usually require minimal changes.
Future Support
FusionCharts, Highcharts, Apache ECharts, Chart.js, and ApexCharts actively maintain their Vue 3 wrappers. D3.js doesn’t have an official wrapper but integrates easily with Vue because it works directly with JavaScript.
Which Vue Chart Library Should You Choose?
The best Vue chart library depends on your application’s requirements. Here’s a quick recommendation by use case.
| Use Case | Recommended Library | Why? |
|---|---|---|
| Enterprise dashboards | FusionCharts | Comprehensive chart types, enterprise support, and built-in features for business applications. |
| SaaS dashboards | FusionCharts / ApexCharts | Excellent for interactive dashboards with responsive, real-time visualizations. |
| Internal dashboards | Chart.js | Lightweight, easy to integrate, and ideal for simple reporting dashboards. |
| Open-source projects | Apache ECharts | Powerful features with a permissive Apache 2.0 license and no commercial licensing fees. |
| Financial dashboards | Highcharts | Advanced charting capabilities and strong support for financial and analytical visualizations. |
| Custom visualizations | D3.js | Offers complete control for building unique, highly customized charts. |
| Gantt charts | FusionCharts | Includes a dedicated Gantt chart component for project planning and scheduling. |
| Geographic maps | FusionCharts | Built-in interactive maps and geospatial visualizations for location-based analytics. |
Ultimately, there isn’t a single “best” Vue chart library for every project. FusionCharts is an excellent choice for enterprise applications; Apache ECharts and Chart.js are strong open-source options; Highcharts excels in advanced analytics; ApexCharts is ideal for modern dashboards; and D3.js remains the go-to library for fully customized data visualizations.
Frequently Asked Questions
What is the best Vue chart library?
The best Vue chart library depends on your project. FusionCharts is ideal for enterprise dashboards and business applications; Apache ECharts excels at large datasets; Highcharts is great for financial reporting; Chart.js is perfect for lightweight dashboards; ApexCharts offers an excellent balance of simplicity and features, and D3.js is best for highly customized visualizations.
Which Vue chart library works best with Vue 3?
All major chart libraries in this comparison support Vue 3. FusionCharts, Highcharts, Apache ECharts, ApexCharts, and Chart.js provide official Vue wrappers, while D3.js integrates directly with Vue using JavaScript. They all work well with the Composition API, Single File Components, and TypeScript.
Which Vue chart library supports real-time updates?
FusionCharts, Apache ECharts, and Highcharts provide excellent support for real-time dashboards with APIs designed for frequent data updates. ApexCharts and Chart.js also support live updates, while D3.js can implement streaming visualizations through custom code.
Which Vue chart library is best for commercial applications?
For commercial applications, FusionCharts and Highcharts are strong choices because they offer commercial licensing, enterprise support, and long-term maintenance. Apache ECharts, Chart.js, and D3.js are free for commercial use under open-source licenses, making them attractive for startups and internal applications.
Are there free Vue chart libraries?
Yes, there are free Vue chart libraries:
- Apache ECharts, Chart.js, and D3.js are free to use in commercial projects under permissive open-source licenses.
- FusionCharts and Highcharts offer free trials and commercial licenses with additional enterprise features and support.
- ApexCharts offers a free community plan for organizations under $2m in revenue and commercial licenses with additional enterprise features and support.
Which Vue chart library performs best with large datasets?
Apache ECharts and Highcharts deliver the best out-of-the-box performance for large datasets. Chart.js also handles large datasets well, while FusionCharts is optimized for enterprise dashboards. D3.js can scale even further but requires manual optimization.
Which Vue chart library supports Gantt charts?
FusionCharts includes a dedicated Gantt chart component, making it a strong choice for project planning, scheduling, and resource management. Most other Vue chart libraries focus on standard chart types and require third-party plugins or custom development for Gantt functionality.
Which Vue chart library supports maps?
FusionCharts offers built-in interactive maps for countries, regions, and custom geographies. Other libraries, such as Apache ECharts and Highcharts, also support geographic visualizations but typically require additional map packages or configuration.
Can I use Chart.js with Vue?
Yes. Chart.js integrates seamlessly with Vue through the official vue-chartjs wrapper. It supports Vue 3, TypeScript, and reactive updates, making it an excellent option for lightweight dashboards and data visualization projects.
Which Vue chart library is easiest to learn?
Chart.js and ApexCharts are generally the easiest libraries to learn because they have simple APIs and require minimal configuration. FusionCharts also offers an intuitive developer experience, while D3.js has a steeper learning curve due to its low-level customization capabilities.
Which Vue chart library has the best documentation?
All of the leading libraries provide comprehensive documentation. FusionCharts, Highcharts, Chart.js, and Apache ECharts are particularly well known for their tutorials, API references, examples, and integration guides, helping developers get started quickly.
Conclusion
Choosing the best Vue chart library depends on your project’s goals, technical requirements, and budget. FusionCharts is a strong option for enterprise dashboards, advanced visualizations, real-time data, Gantt charts, and maps. Chart.js works well for lightweight projects, while Apache ECharts is ideal for open-source, data-intensive dashboards. Highcharts suits financial and commercial applications, ApexCharts is a good fit for modern SaaS dashboards, and D3.js offers maximum control for custom visualizations.
Before making a final decision, compare each library’s Vue 3 support, performance, chart types, licensing, documentation, and long-term maintenance. The right choice should meet your current needs while giving your application room to grow.
For teams building feature-rich commercial or enterprise applications, FusionCharts provides a broad set of ready-to-use charts, maps, real-time visualizations, and dedicated support within one platform.
Ready to Build Interactive Vue Charts?
Whether you’re building an enterprise dashboard, a SaaS analytics platform, or a data-driven business application, FusionCharts gives you everything you need to create rich, interactive visualizations with confidence. With 100+ chart types, 1,400+ interactive maps, Gantt charts, real-time updates, and seamless Vue 3 integration, you can build production-ready dashboards faster while reducing development effort.
Start your free FusionCharts trial today and explore all the features before making your decision.
👉 Download the Free FusionCharts Trial