Reference Zone
Reference zones are similar to reference lines, except that it marks out an entire zone rather than just a line. Reference zones help you identify data plots that fall under the zone. In FusionTime, a reference zone has two fixed values filled by a color. You can use n number of reference zones in a canvas.
Refer to the image below:
The salient features of a reference zone are:
You can specify a minimum value and a maximum value to draw a reference zone.
You can create one or more reference zones on canvas for each y-axis (in case the chart has multiple y-axes).
You can customize the color and other cosmetic properties to each reference zone.
When you hover over the reference zone, the data plots falling in the zone get highlighted.
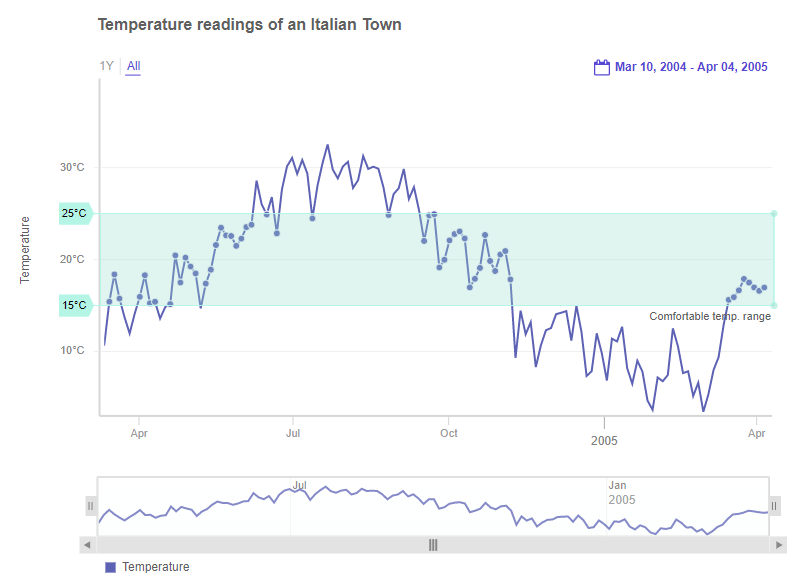
A chart with a reference zone looks like as shown below:
In the above chart, a reference zone appears parallel to the time axis. Hover on the zone to see the label and the value.
Add a Reference Zone
You can add a reference zone using the following attributes of the referenceZone object inside the YAxis object:
Use the
valueMaxattribute to set the value up to which you want to create the reference zone.Use the
valueMinattribute to set the value from where you want to create the reference zone.Use the
labelattribute to set the text of the label.
Refer to the code given below:
{
type: "timeseries",
dataSource: {
yAxis: [{
// Reference Zone
"referenceZone": [{
"label": "Target",
"valueMax": 3000,
"valueMin": 2000
}],
}]
}
}Reference Zone in Dual Y-axis Chart
For a time-series chart with dual y-axis, you can add reference zones for each y-axis on the canvas. A chart with multiple reference zones for dual y-axis is shown below:
In the above chart, if you hover over the notch of each reference zone, you will notice that the minimum and maximum values of the zone will be visible on the axis for which the reference zone has been drawn.
The code to render the reference zone in a dual Y-Axis chart is given below:
dataSource: {
yAxis: [{
plot: "Temperature",
title: "Temperature (in °C)",
referenceZone: [{
label: "Controlled Temperature",
value: "6"
}]
}, {
plot: "Carbon mono-oxide",
title: "CO (in µg/m³)",
referenceZone: [{
label: "Controlled Carbon mono-oxide",
value: "3"
}]
}],
}Customize a reference zone
You can use CSS styling to the cosmetic properties of the reference zone. To set the styling, use the familiar CSS styling approach of specifying the different style parameters in the style object of the referenceZone object. Even the cosmetic properties for the hover effect of each reference zone can be specified.
Refer to the code given below:
referenceZone: [{
label: "Label",
valueMin: "2000",
valueMax: "3000",
style: {
"marker": { },
"marker:hover": { },
"marker-zone": { },
"marker-zone:hover": { },
"marker-tag": { },
"text": { },
"marker-text": { },
"marker-notch": { },
"marker-notch:hover": { },
"marker-notch-connector": { },
"marker-notch-connector:hover": { }
}
}]In the above code:
Create
styleobject underreferenceZoneobject to add styling to the different elements of the reference zone.In the
styleobject:markeris used to style the zone, label, values, and notch.marker:hoveris used to style the zone, label, values, and notch when hovered.marker:zoneis used to style the fill zone of the reference zone.marker-zone:hoveris used to style the fill zone of the reference zone when hovered.marker-tagis used to style the tags which occur when we hover over the reference zone to view values and labels.textis used to style all the texts of the reference zone.marker-textis used to style the values (min and max) of the reference zone. The style applied using this attribute overrides the style applied using thetextattribute.marker-notchis used to style the notch of the reference zone.marker-notch:hoveris used to style the notch of the reference zone when hovered.marker-notch-connectoris used to style the connector of the notch at the end of the reference zone.marker-notch-connector:hoveris used to style the connector of the notch at the end of the reference zone when hovered.
Reference Zone in a MultiVariate Chart
For a time-series chart with multi canvases, you can add reference zones for each canvas of the chart. A multi-variate time-series chart with reference zones is shown below:
In the above chart, if you hover over the notch of each reference zone, you will notice that the the minimum and maximum values of the zone will be visible on the axis for which the reference zone has been drawn on the respective canvases.
The code to render the reference zone in a multi-variate chart is:
dataSource: {
data: dataStore,
caption: {
text: "Pollution Control Report"
},
yAxis: [{
plot: "Temperature",
title: "Temperature (in °C)",
referenceZone: [{
label: "Comfortable temp. range",
valueMin: "15",
valueMax: "25",
style: {
marker: {
fill: "#D2C9FF",
stroke: "#D2C9FF"
},
"marker-text": {
fill: "#000000"
},
"marker:hover": {
fill: "#D2C9FF"
},
"marker-zone:hover": {
"stroke": "#D2C9FF"
},
"marker-notch:hover": {
"stroke": "#D2C9FF"
}
}
}]
}, {
plot: "Carbon mono-oxide",
title: "CO (in µg/m³)",
referenceZone: [{
label: "Acceptable range - CO",
valueMin: "1.5",
valueMax: "3",
style: {
marker: {
fill: "#B4F5E6",
stroke: "#B4F5E6"
},
"marker-text": {
fill: "#000000"
},
"marker:hover": {
fill: "#98DECD"
},
"marker-zone:hover": {
"stroke": "#B4F5E6"
},
"marker-notch:hover": {
"stroke": "#B4F5E6"
}
}
}]
}]
}Reference Zone in a Range Series Chart

In an area-range series chart, the reference zone only highlights plots when their minimum and maximum values fall between the zone.
In a column-area range series chart columns don't get highlighted.
An area-range chart with a reference zone looks as shown below:
In the above chart, if you hover over the notch of each reference zone, you will notice that the minimum and maximum values of the zone will be visible on the axis for which the reference zone has been drawn.