Time Marker
FusionTime lets you mark events on the time axis. A time marker appears as an overlay on the canvas. When you hover the mouse pointer over a time marker, a tooltip appears with the information about the marker.
A time marker can be of two types:
- Time instance marker - It occurs at a given instance of time.
- Time band marker - It occurs over a span of time.
Time instance marker
To create a single time instance marker follow the steps below:
Create a
timeMarkerobject underxAxisobjectWithin the
timeMarkerobject use thestartattribute to define the time instance at which the marker should be drawn.Within the
timeMarkerobject use thetimeFormatattribute to define the format of the time specified in thestartattribute.Within the
timeMarkerobject use thelabelattribute to define the label for the time marker.
Refer to the code below:
"xAxis": {
"timemarker": [{
"start": 'Mar-1982',
"label": 'Economic downturn was triggered by {br} tight monetary policy in an effort to {br} fight mounting inflation.',
"timeFormat": "%b-%Y"
}],
}A sample chart with a time marker is shown below:
To create repeatable time instance markers, follow the steps given below:
- Set the above attributes and the specify the following attribute:
- Within the
timeMarkerobject create therepeatobject to define the frequency, at which the cyclic time marker will be repeated. - Use the
unitattribute to define the time unit for the time marker inside therepeatobject. You can set its value as Year, Quarter, Month, Week, Day, Hour, Minute, Second, or Millisecond. You can also set its value as one of the weekdays (Sunday, Monday, Tuesday, Wednesday, Thursday, Friday, or Saturday). - Use the
multiplierattribute to define the multiplier of the time unit. By default, this value is1. - Use the
endattribute to define the end time for the marker. Note that if you set the end of the date/time, then the marker will be presented as a band. If you omit it instead, the marker will be represented as a line.
- Within the
Refer to the code below:
xAxis: {
plot: 'Time',
timemarker: [{
start: 'Mar-1980',
label: 'US inflation peaked at 14.8%.',
timeFormat: "%b-%Y",
repeat: {
unit: 'Year',
multiplier: 5
},
style: {
marker: {
fill: '#f8b8b7'
}
}
},
}The sample chart with repeated time instance markers is shown below:
In the above sample, the time marker is a specific point on the time axis. You can also render the time marker from top to bottom (vertically) of the canvas by setting the value of type attribute to full within the time marker object.
Refer to the code given below:
xAxis: {
plot: 'Time',
timemarker: [{
start: 'Mar-1980',
label: 'US inflation peaked at 14.8%.',
timeFormat: "%b-%Y",
type: 'full'
repeat: {
unit: 'Year',
multiplier: 5
},
style: {
marker: {
fill: '#f8b8b7'
}
}
}]
}A sample chart is shown below:
Time span marker
To create the marker just include the end attribute along with the other attributes of the single time instance marker under the timemarker object within the xAxis object. Refer to the code below:
Refer to the code below:
xAxis: {
plot: 'Time',
timemarker: [{
start: 'Mar-1980',
end: 'Jun-1983',
label: 'US inflation peaked at 14.8%.',
timeFormat: "%b-%Y",
style: {
marker: {
fill: '#f8b8b7'
}
}
}]
}A sample chart with time span markers is shown below:
In the above sample, the time marker has a specific height according to the width and height of the chart. You can also render the time span marker with a line from top to bottom (vertically) of the canvas by setting the value of type attribute to full within the timeMarker object.
Refer to the code given below:
xAxis: {
plot: 'Time',
timemarker: [{
start: 'Mar-1980',
end: 'Jun-1983',
label: 'US inflation peaked at 14.8%.',
timeFormat: "%b-%Y",
type: 'full',
style: {
marker: {
fill: '#f8b8b7'
}
}
}]
}A sample chart is shown below:
Time Span Marker Tooltip
The showTimeSpanMarkerTooltipAt attribute allows you to configure the behavior of time span marker tooltips. This attribute accepts either 1 or 0.
Setting
showTimeSpanMarkerTooltipAtto 0 disables the time span marker tooltip.Setting
showTimeSpanMarkerTooltipAtto 1 shows the time span marker tooltip while the time span marker width is less than the width of the chart canvas.When
showTimeSpanMarkerTooltipAtis not specified the behavior is the same as setting it to 1.
When showTimeSpanMarkerTooltipAt is set to 0 if you hover the mouse over any part of the chart canvas a vertical crossline shows bin details in a tooltip.
In the example below showTimeSpanMarkerTooltipAt is set to 1, hovering over a time span marker shows its tooltip. If we zoom in until the time span marker is bigger than the chart canvas, hovering over the time span marker now shows a vertical crossline displaying bin details on a tooltip. This behavior could be useful in cases where you have various time span markers that should be easy to identify on a zoomed out view and can be explored in more detail while zoomed in.
Refer to the code given below:
xAxis: {
plot: 'Time',
showTimeSpanMarkerTooltipAt: 1,
timemarker: [{
start: 'Mar-1980',
end: 'Jun-1983',
label: 'US inflation peaked at 14.8%.',
timeFormat: "%b-%Y",
type: 'full',
style: {
marker: {
fill: '#f8b8b7'
}
}
}]
}Style Definition
You can set the cosmetic properties of all the parts of a time marker using familiar CSS styling approach by specifying the different style parameters in the 'style' object' of the 'timeMarker' object. Even the cosmetic properties for the hover state of each time marker element can be specified.
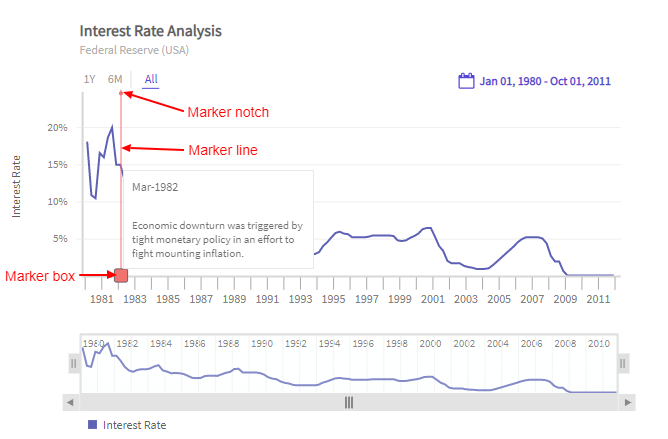
The image below highlights the marker-box, marker-line, and the marker-notch of the time marker.
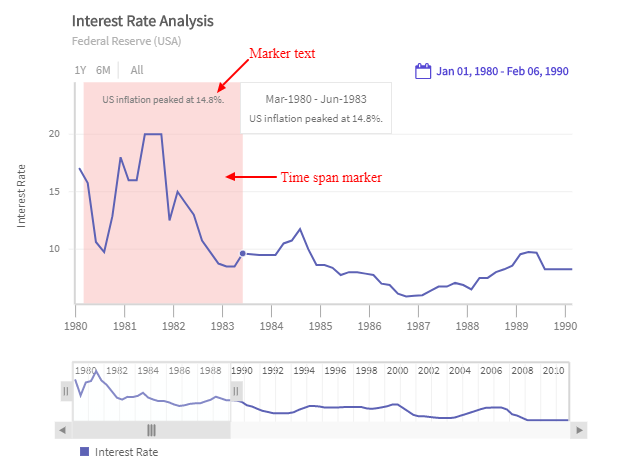
The image below highlights the time marker and the text of the time marker.
Refer to the code given below:
"dataSource": {
"yAxis": [{
"timemarker": [{
"style": {
"marker": { }, // Affects style of marker box, line and notch
"marker:hover": { }, // Affects hover style of marker box, line and
// notch
"marker-box": { },
"marker-box:hover": { },
"marker-line": { },
"marker-line:hover": { },
"marker-notch": { },
"marker-notch:hover": { },
"text": { },
"text:hover": { }
}
}]
}]
}In the above code:
- Create a
styleobject undertimemarkerobject to add styling to the different elements oftimemarker. - In the style
object:markeris used to style the marker box, line, and notch.marker:hoveris used to style the marker box, line, and notch when hovered.marker-boxis used to style the marker box of the time marker.marker-box:hoveris used to style the marker box of the time marker when hovered.marker-lineis used to style the marker line of the time marker.marker-line:hoveris used to style the marker line of the time marker when hovered.marker-notchis used to style the notch of the time marker.marker-notch:hoveris used to style the notch of the time marker when hovered.textis used to style the text of the time marker.text:hoveris used to style the text of the time marker when hovered.
Don't forget to enable
enableUTCattribute when DayLightSaving impacts the dataset.