Tooltips
Tooltips provide on-demand additional context for different visual elements in a chart. They pop up when you hover the mouse pointer over an element or tap (on mobile devices) on it. Chart elements that can have tooltips include data plots, data labels, and the axes.
The above image is of a single series chart which displays context-sensitive information in the tooltip when the pointer has hovered over a particular data plot. The information displayed in the tooltip includes:
- Date
- Column name
- Value of the data plot
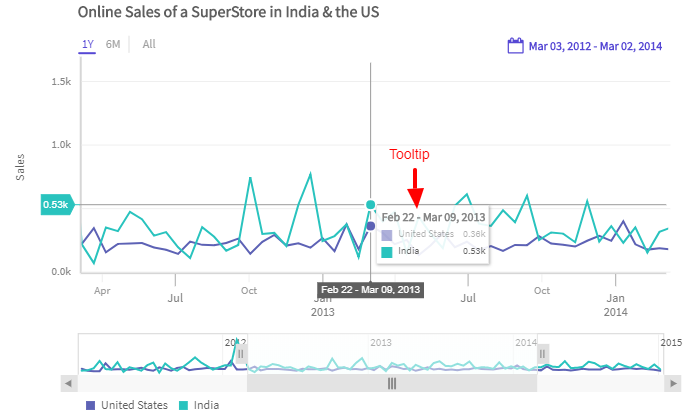
Now, let’s create a multi-series chart which will compare online sales of SuperStore in United States of America and India.
In the given example, you can see a multi-series line graph - displaying the sales figures of a company in India and in United States of America. Hover the mouse pointer over a particular time on the time axis, and you will see a consolidated tooltip showing the names and sales values for both data plots at that point.
Tooltips are extremely useful when you want to compare data using a multivariate chart. In a multivariate chart, when you hover over a data plot in one of the canvases, tooltips appear in the other canvases at that particular point in time as well.
In the example given above, you can see the Global Online Sales of a Superstore, with the canvases showcasing the sales, quantities sold, and shipping costs in three different canvases. When you hover the pointer over a particular plot in the Sales canvas, you will notice that tooltips appear in the Quantity and Shipping Cost canvases as well, at the same point. This way, you can easily view consolidated data regarding sales at any point in time.
By default, the tooltip is displayed. To hide the tooltip set the enabled attribute to false.
Refer to the code below:
"dataSource": {
"tooltip": {
"enabled": "false", // Disables the Tooltip
}
}Tooltips in Time Markers
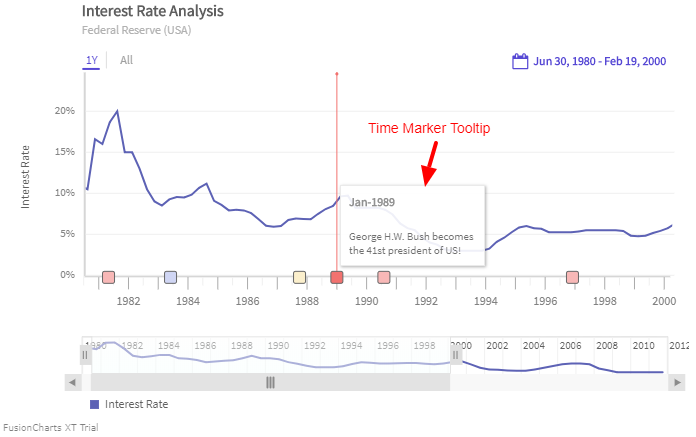
Tooltips help you gain additional, context-sensitive information from time markers. When you hover the mouse pointer over a time marker, a tooltip appears with the value of the marker, as well as any information you include in the tooltext of the timemarker object for that particular tooltip. When a time marker represents a range, the corresponding tooltip displays information on the range instead.
For instance, depending on the date/time format you select, the data in the tooltip will look like one of the following:
- November 11, 2018
- November 10-13, 2018
- Oct 29 - Nov 6, 2018
- Dec 28, 2017 - Jan 10, 2018
- Nov 5, 2018 16:00 - 20:00
- Nov 5, 16:00 - Nov 6, 2018 23:00
- Dec 31, 2017 18:00 - Jan 1, 2018 12:00
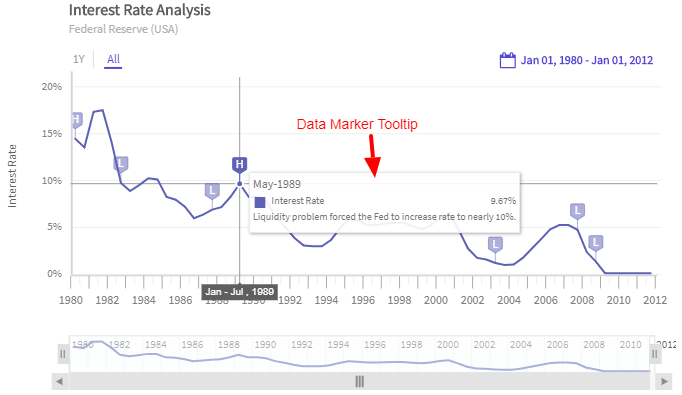
Tooltips in Data Markers
Tooltips can provide additional information about the data represented by data markers. When you hover the mouse pointer over a data marker, a tooltip can appear and display the data value, as well as a small description.
Output time format
FusionTime supports the following time units:
- Year
- Month
- Day
- Hour
- Minute
- Second
- Millisecond
You can customize the output time format for each time unit by specifying date-time tokens for respective time format.
Refer to the example given below:
In the above example, hover on the data plot to view the tooltip with custom output time format. Refer to the code below:
<--
dataSource: {
data: dataStore,
chart: {
showLegend: "0",
paletteColors: "#58EBCA"
},
caption: {
text: "Daily Visitors Count of a Website"
},
subCaption: {
text: "Time format of (data plot) tooltip has been customized"
},
yAxis: [{
plot: {
value: "Daily Visitors",
type: "smooth-line"
},
format: {
suffix: "k"
},
title: "Daily Visitors Count"
}],
-->
tooltip: {
enabled: "false", // Disables the Tooltip
outputTimeFormat: {
day: "%d/%m/%y (%a)"
},
style: {
container: {
"border-color": "#000000",
"background-color": "#75748D"
},
text: {
"color": "#FFFFFF"
}
}
}
}In the above code:
- Define the
tooltipobject. - Create the
outputTimeFormatobject. - Set the custom output time format for day as
%d/%m/%y (%a)respectively.
If yo do not set the data-time tokens for any time unit, the default formatting for the particular time unit will apply.
The date-time tokens for respective time formats is given below:
| Time Unit | Tokens | Example | |
|---|---|---|---|
| Year | %Y |
2018 | |
| Month | %B, %Y |
September, 2018 | |
| Day | %B %-d, %Y |
November 11, 2018 | |
| Hour | %b %-d, %Y, %-I %p |
Nov 5, 2018, 4 PM | |
| Minute | %b %-d, %Y, %-I:%-M %p |
Nov 5, 2018, 4:24 PM | |
| Second | %b %-d, %Y, %-I:%-M:%-S %p |
Nov 5, 2018, 4:25:30 PM | |
| Millisecond | %b %-d, %Y, %-I:%-M:%-S:%-L %p |
Nov 29, 2017, 4:29:12.075 PM |
Style Definition
FusionTime allows you to customize the tooltip of the chart. All the customizations to the tooltip can be made using the newly introduced tooltip object under dataSource. The customization effects all the tooltips of the chart, i.e.:
- Plot Tooltip
- Data Marker Tooltip
- Time Marker Tooltip
The styling of the tooltip in FusionTime is handled by HTML styling.
The syntax of the tooltip object is given below:
"dataSource": {
"tooltip": {
"enabled": Boolean,
"style": {
"container": {
"padding": "10px"
},
"text": {
"font-size": "16"
},
"header": {
"font-color": "#ff0000"
},
"body": {
"font-color": "#ff00ff"
}
}
}
}In the above code:
tooltipis the object to customize the tooltip of the chart.enabledattribute is used to enable or disable the tooltip.- The customization for the tooltip is in
styleobject.containercustomizes the containing box of the tooltip.textcustomizes the text of the tooltip.headercustomizes the header at the top of the tooltip.bodycustomizes all the text other than theheadertext.
Customise Tooltip content
FusionTImes Version 2.5 added a new attribute property inside tooltip object named toolText, this attribute throigh the use of macros accepts input to custom tooltip content. The list of supported macros is given below:
$series.plotIndex.name- Returns the name of data series for respective index.$series.plotIndex.color- Returns the palette/fill color of data series for respective index.$series.plotIndex.plotIdentifier- Returns the legend/plot icon of data series for respective index. This icon must be in-sync with legend of the chart.$series.plotIndex.value- Returns the unformatted value for respective index. In case of OHLC or a candlestick chart, the following 4 macros are used instead:$series.plotIndex.openValue- Returns the unformatted open value.$series.plotIndex.highValue- Returns the unformatted high value.$series.plotIndex.lowValue- Returns the unformatted low value.$series.plotIndex.closeValue- Returns the unformatted close value.$series.plotIndex.volumeValue- Returns the unformatted volume value.$series.plotIndex.dataValue- Returns the default formatted value for respective index. In case of OHLC or a candlestick chart, the following 4 macros are used instead:$series.plotIndex.openDataValue- Returns the formatted open value.$series.plotIndex.highDataValue- Returns the formatted high value.$series.plotIndex.lowDataValue- Returns the formatted low value.$series.plotIndex.closeDataValue- Returns the formatted close value.$series.plotIndex.volumeDataValue- Returns the formatted volume value.$bin- Returns the time spread in context (from-to). Eg. 12 Jan 2020 - 15 Jan 2020.$binStart- Returns the start time of the bin. Eg. 12 Jan 2020.$binEnd- Rreturns the end time of the bin. Eg. 15 Jan 2020.