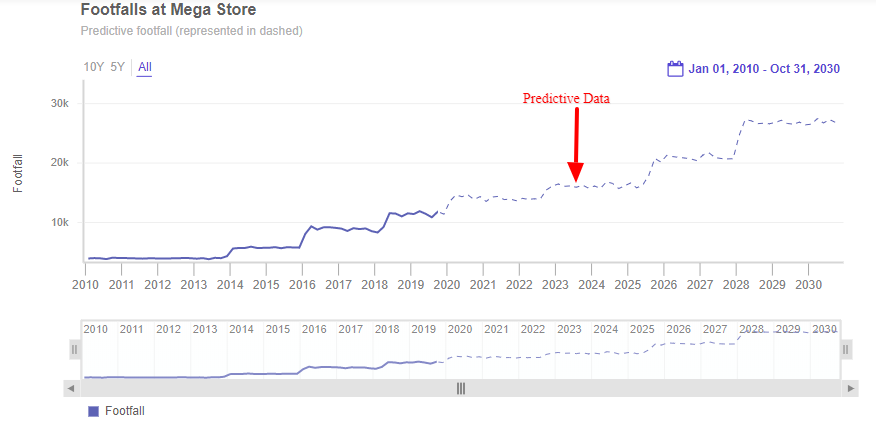
Predictive data representation
Forecasting has always been an important aspect of time-series data representation and with FusionCharts.NET v1.0.7 we want to ensure that our library has the capability to represent predictive data values.
The product does not forecast values right now; it just represents the data which are predicted (once specified) differently.
To represent your predicted data in different styles, FusionCharts.NET allows you to specify the date (from the data you will use) beyond which the rendered data will have styling different from the default rendered data plots.
Refer to the image below:
Configure Predictive Data
To add predictive data in a chart, you need to use the PredictiveData object under vizObj object. To specify the predictive data to a chart, use the PredictionDate object under PredictiveData object.
Refer to the code given below:
vizObj.PredictiveData.PredictionDate = new DateTime(2018, 2, 1);The chart looks like as shown below: