Time Navigator
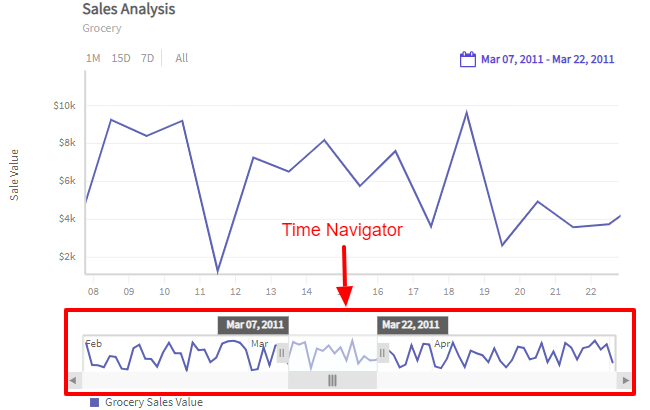
The time navigator plots the complete data in a rectangular box located right below the time axis. It helps you focus on details in a specific time period while staying in context of the whole timeline.
A time navigator looks as shown in the image below:
Show/Hide Time Navigator
To show the time navigator, set to true the value of the Enable property of the TimeNavigator object of the timeSeries class. Refer to the code given below:
/* time navigator */
timeSeries.TimeNavigator.Enable = true;Now, we will discuss about the different interactions of the time navigator.
Zoom in/out
You can use the handles on either side to select a time period. The data plot in the canvas zooms in/out respectively. This behavior is also applicable when you zoom in/out from the chart canvas, i.e., with the interaction in the chart canvas the time navigator gets updated accordingly. Refer to the image below:

Pan the active window
You can pan the active window across the time navigator and see the data plots in the canvas update accordingly. Refer to the image below:

Active window labels
When you hover the mouse pointer on the active window of the time navigator, the time labels appear on the both the ends of the active window showing the start date/time and the end date/time. You can drag these labels to change the active window. Refer to the image below:
