Tooltip
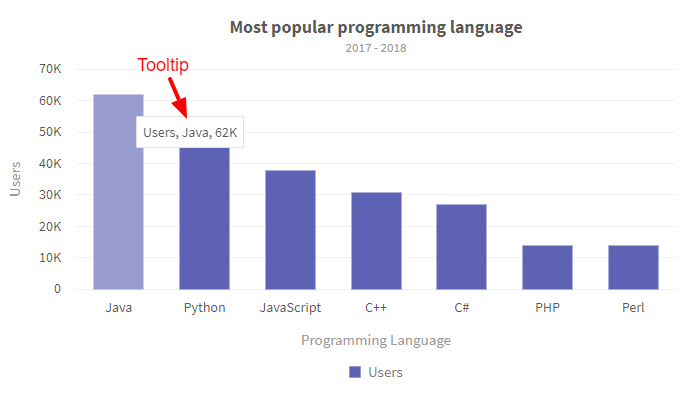
A tooltip is a small box that pops up when you hover the mouse pointer over certain chart elements, such as data plots and axis labels. It displays context-sensitive information about the element, such as the underlying data value and the name of the data series that the element belongs to.
A tooltip looks as shown in the image below:
Enable Tooltips
To enable tooltips in a timeseries chart, set the Enable property of the ToolTip object of the timeSeries class to true.
Refer to the code given below:
timeSeries.ToolTip.Enable = true;