Y-Axis
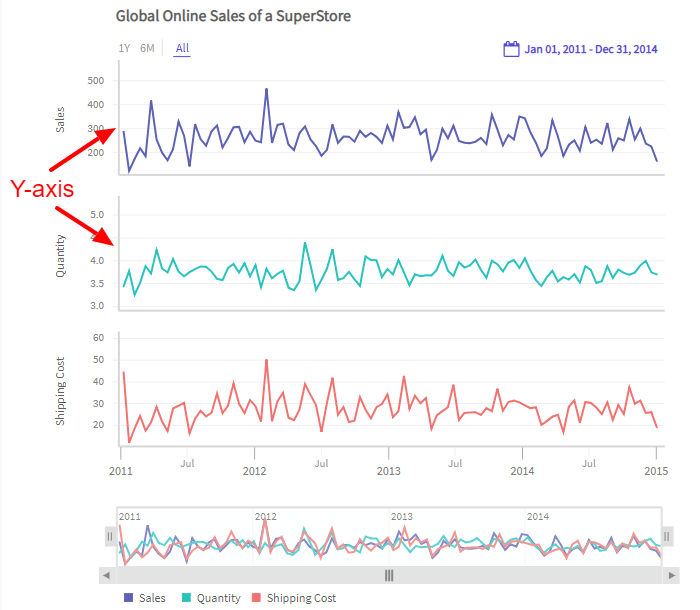
A timeseries chart can have one or more Y-axes. The latter situation occurs when you need to build a multi-series or multivariate chart.
A Y-axis in a timeseries chart looks as shown in the image below:
Configure Y-axis
Use the YAxes object of the timeSeries instance of the TimeSeriesChart class to define a Y-axis. After that, use the following to configure the axes.
Set the aggregation function using the
Aggregationproperty ofYAxesobject. which accepts enum of typeTimeSeriesAggregation.Function.TimeSeriesAggregation.Functioncan accept one of the enum values fromSUM,COUNT,MAX,MIN,LAST,FIRST,AVERAGE,VARIANCEorSTDDEV.Set the axis type using the
AxisTypeproperty of theYAxesobject, which accepts enum of typeTimeSeriesYAxisObject.YAxisType.TimeSeriesYAxisObject.YAxisTypecan accept the following enum values:LINEARLOG
Set a prefix for the values on the Y-axis using the
Prefixproperty of theFormatobject.Prefixaccepts a string type parameter.Set a suffix for the values on the Y-axis using the
Suffixproperty of theFormatobject.Suffixaccepts a string type parameter.Set the maximum value for the Y-axis using the double type
Maxproperty of theYAxesobject.Set the minimum value for the Y-axis using the double type
Minproperty of theYAxesobject.Set the plot type using the
PlotTypeproperty of theYAxesobject, which accepts enum of typeTimeSeriesYAxisObject.SeriesPlotType.TimeSeriesYAxisObject.SeriesPlotTypecan accept the enum values fromLINE,COLUMN,AREA,SPLINE,STEPLINE,OHLCandCANDLESTICK.Set the Y-axis title using the string type
Titleproperty of theYAxesobject.Finally, to set the plot type for the chart, use the
Add()method of thePlotobject.
Refer to the code given below:
/* add different configuration */
timeSeries.YAxes.Aggregation = TimeSeriesAggregation.Function.COUNT;
timeSeries.YAxes.AxisType = TimeSeriesYAxisObject.YAxisType.LINEAR;
timeSeries.YAxes.Format.Prefix = "$";
timeSeries.YAxes.Format.Suffix = "K";
timeSeries.YAxes.Max = 30000;
timeSeries.YAxes.Min = 10000;
timeSeries.YAxes.PlotType = TimeSeriesYAxisObject.SeriesPlotType.AREA;
timeSeries.YAxes.Title = "Total Sales";
timeSeries.YAxes.Plot.Add("GDP", TimeSeriesYAxisObject.YAxisType.LOG, TimeSeriesAggregation.Function.LAST);The chart will look as shown below:
Add More Plots
If you want to add another plot to a chart (for multi-series charts), overload the Add() method of the Plot object. You can overload the Add() method in four different ways, as given below:
Plot.Add(string param)- TheAdd()method accepts the name of the plot as a string.Plot.Add(string param,TimeSeriesYAxisObject.YAxisType.LOG param)- TheAdd()method accepts the name of the plot as a string and the type of the Y-axis as theTimeSeriesYAxisObject.YAxisTypeenum. The enum can have the following values:LINEARLOG
Plot.Add(string param,TimeSeriesAggregation.Function.LAST param) - The
Add()method accepts the name of the plot as a string and the aggregation function applied to the Y-axis as theTimeSeriesAggregation.Functionenum. The enum can accept one of the values fromSUM,COUNT,MAX,MIN,LAST,FIRST,AVERAGE,VARIANCEorSTDDEV.Plot.Add(string param,TimeSeriesYAxisObject.YAxisType.LOG param,TimeSeriesAggregation.Function.LAST param)- TheAdd()method accepts the name of the plot as a string, the type of the Y-axis as theTimeSeriesYAxisObject.YAxisTypeenum, and the aggregation function applied to the Y-axis as theTimeSeriesAggregation.Functionenum.
You can overload the Add() method in one of the ways given above, to add more than one Y-axis to a timeseries chart.
Refer to the code below:
/* add another plot */
/* required for Multiple Data plots */
timeSeries.YAxes.Plot.Add("Population", TimeSeriesYAxisObject.YAxisType.LOG, TimeSeriesAggregation.Function.LAST);The chart will look as shown below:
Add a Y-axis
If you want to build a multivariate chart, you will need to create more than one Y-axis. Once you are done creating the first Y-axis, use the AddNew() method of the YAxes object to create a second Y-axis. You can repeat this process as many times as you need to.
Refer to the code given below:
/* add another YAxis */
/* this is for Multivariate chart */
timeSeries.YAxes.AddNew();The chart will look as shown below: