Reference Zone
Reference zones are similar to reference lines, except that it marks out an entire zone rather than just a line. Reference zones help you identify data plots that fall under the zone. In FusionCharts.NET, a reference zone has two fixed values filled by a color. You can use n number of reference zones in a canvas.
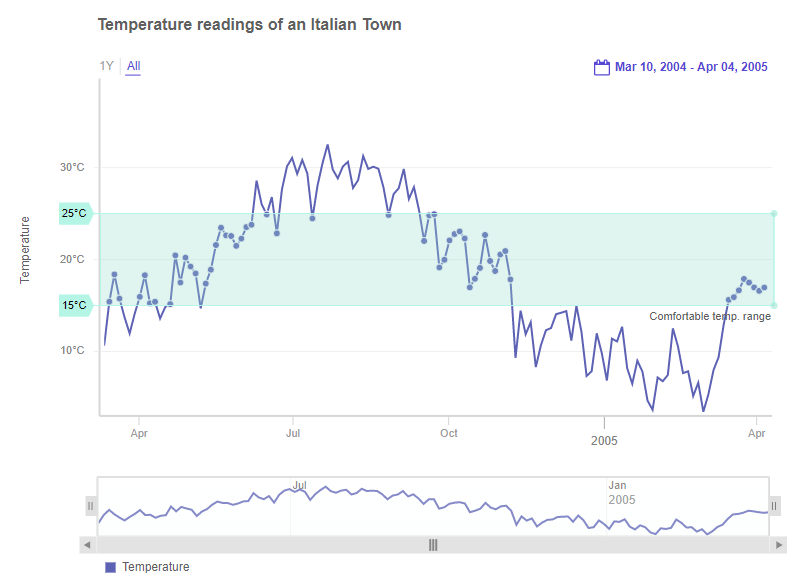
Refer to the image below:
The salient features of a reference zone are:
You can specify a minimum value and a maximum value to draw a reference zone.
You can create one or more reference zones on canvas for each y-axis (in case the chart has multiple y-axes).
You can customize the color and other cosmetic properties to each reference zone.
When you hover over the reference zone, the data plots falling in the zone get highlighted.
Configure Reference Zone
To include a reference zone in a chart, you need to use the ReferenceZone object under YAxes object.
After that, follow the steps to set the max, min value of the reference zone:
Use the
Valueproperty to set the value of the reference zone.Use the
Maxproperty to set the value up to which you want to create the reference zone.Use the
Minproperty to set the value from where you want to create the reference zone.Use the
Labelproperty to set the text of the label.
Refer to the code given below:
vizObj.YAxes.ReferenceZone.Value = 20000;
vizObj.YAxes.ReferenceZone.Min = 10000;
vizObj.YAxes.ReferenceZone.Max = 150000
vizObj.YAxes.ReferenceZone.Label = "sample 1";A reference zone in a time-series chart looks like as shown below:
The code to add multiple reference zone to your chart is given below:
vizObj.YAxes.ReferenceZone.AddNew();In the above code, firstly you invoke the AddNew() method and then set the above mentioned properties.