Time Markers
You can mark events on the Time Axis using Time Markers. A time marker appears as an overlay on the chart canvas. When you hover the mouse pointer over a time marker or tap on it, a tooltip appears with information about the marker.
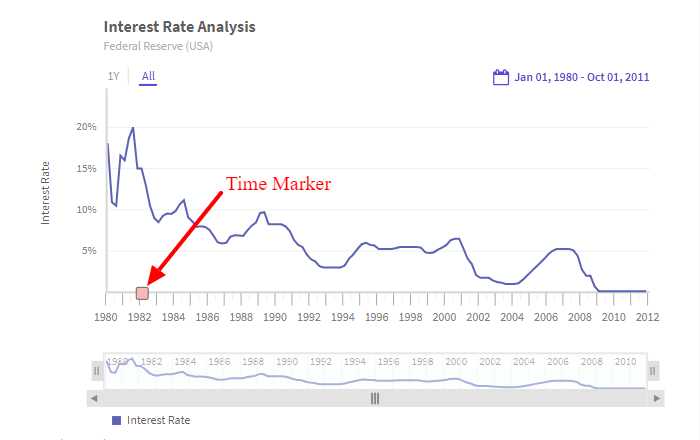
A time marker looks as shown in the image below:
Configure Time Marker
A time marker can either mark a single point, or a range, on the time axis. Use the AddMarker() method of the TimeMarker object to create a time marker. AddMarker() accepts a string type parameter, which contains the label name for the marker. Once you create the time marker, use the following instance methods of AddMarker() to configure the time marker:
Use the
EndDate()method, which accepts a DateTime type parameter, to set the end date of the range.Use the
StartDate()method, which accepts a DateTime type parameter, to set the start date of the range.Use the
Multiplier()method, which accepts an integer type parameter, to set the multiplier of the time unit.Use the
TimeFormat()method, which accepts a string type parameter, to set the data format used in the data.Use the
TimeUnit()method, which accepts an enum of typeTimeSeriesUnit.Time, to set the unit for the time.
Refer to the code below:
/* Time marker */
/* AddMarker() return an instance of TimeMarker Object */
/* EndDate(), StartDate(), Multiplier(),TimeFormat, TimeUnit() are instance methods of AddMarker() and can be invoked as below */
timeSeries.TimeAxis.TimeMarker.AddMarker("label").EndDate(new DateTime(2010, 12, 31)).Multiplier(2).StartDate(new DateTime(2010, 01, 01)).TimeFormat("%b-%Y").TimeUnit(TimeSeriesUnit.Time.YEAR);The code given above will create a time marker for a period of time. To create a time marker for a specific point, simply omit the
EndDate()instance method.
Don't forget to enable
enableUTCattribute when DayLightSaving impacts the dataset.
A sample chart with a time marker is shown below: