Create a Chart in Java
FusionCharts is a JavaScript charting library that enables you to create interactive charts, gauges, maps and dashboards in JavaScript. We have built a simple server-side Java (JSP) wrapper for FusionCharts. The FusionCharts server-side JSP wrapper lets you easily add rich and interactive charts to any JSP project. Using the wrapper, you can create charts in your browsers, without writing any JavaScript code.
Let's see how to install FusionCharts and render a chart using the FusionCharts server-side JSP wrapper.
Prerequisite
We assume that you have Java installed in the system. If not, you can visit How to install Java page and follow the installation steps. You will also need a local web server, Eg.- tomcat server ( "pure Java" HTTP web server environment for Java code to run in) that will implement the jsp file. You can download it here.
The FusionCharts JSP wrapper requires JAVA 6 or higher.
Installation & Including Dependencies
Download the FusionCharts library to get the jsp-fusioncharts wrapper.
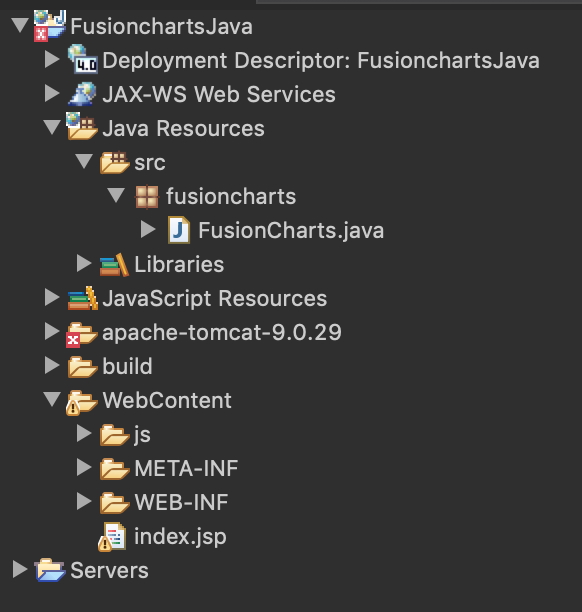
Create a new Java dynamic web project (we have named it as FusionchartsJava) and follow the steps below:
Create a new package named as
fusionchartsinsideJava resources > src. Now copy thejsp-fusionchartswrapper (fusioncharts-suite-xt > integrations > java > fusioncharts-wrapper) to the newly created fusioncharts package (Java resources > src>fusioncharts).Copy the
jsdirectory (Only for Local Files) which contains all the javascript files (fusioncharts-suite-xt > js) in theWebContentfolder present in the project(FusionchartsJava) directory.Create an
index.jspfile inside the WebContent directory.
The directory structure will look like this:
Configure your chart
Firstly, you've to work on the styling, the positioning and giving your chart a context. Follow the steps below:
- In the
index.jspfile, we first include the Fusioncharts Javascript files to apply style to the chart.
// Include FusionCharts core file
<script type="text/javascript" src="https://cdn.fusioncharts.com/fusioncharts/latest/fusioncharts.js"></script>
// Include FusionCharts Theme file
<script type="text/javascript" src="https://cdn.fusioncharts.com/fusioncharts/latest/themes/fusioncharts.theme.fusion.js"></script>
// Include FusionCharts core file
<script type="text/javascript" src="${pageContext.request.contextPath}/js/fusioncharts.js"></script>
// Include FusionCharts Theme file
<script type="text/javascript" src=_"\${pageContext.request.contextPath}/js/themes/fusioncharts.theme.fusion.js"_></script>
- Add the chart attributes in index.jsp file. FusionCharts accepts data in JSON format, so we convert these attributes into JSON format. We are creating a chart showing the "Countries With Most Oil Reserves" and we define the chart attributes accordingly.
// store chart config name-config value pair
<%
Map<String, String> chartConfig = new HashMap<String, String>();
chartConfig.put("caption", "Countries With Most Oil Reserves [2017-18]");
chartConfig.put("subCaption", "In MMbbl = One Million barrels");
chartConfig.put("xAxisName", "Country");
chartConfig.put("yAxisName", "Reserves (MMbbl)");
chartConfig.put("numberSuffix", "k");
chartConfig.put("theme", "fusion");
StringBuilder jsonData = new StringBuilder();
// json data to use as chart data source
jsonData.append("{'chart':{");
for(Map.Entry conf:chartConfig.entrySet())
{
jsonData.append("'" + conf.getKey()+"':'"+conf.getValue() + "',");
}
jsonData.replace(jsonData.length() - 1, jsonData.length() ,"},");
%>Preparing the data
As already mentioned above, let's create a chart showing the "Countries With Most Oil Reserves". The data of the oil reserves present in various countries is shown in tabular form below:
| Country | No. of Oil Reserves |
|---|---|
| Venezuela | 290K |
| Saudi | 260K |
| Canada | 180K |
| Iran | 140K |
| Russia | 115K |
| UAE | 100K |
| US | 30K |
| China | 30K |
Since we are plotting a single dataset, let us create a column 2D chart with 'countries' as data labels along x-axis and No. of oil reserves as data values along y-axis. Let us prepare the data for a single-series chart.
FusionCharts accepts the data in JSON format, So, we first add the data and then convert into the JSON format.
//store label-value pair
<%
Map<String, Integer> dataValuePair = new HashMap<String, Integer>();
dataValuePair.put("Venezuela", 290);
dataValuePair.put("Saudi", 260);
dataValuePair.put("Canada", 180);
dataValuePair.put("Iran", 140);
dataValuePair.put("Russia", 115);
dataValuePair.put("UAE", 100);
dataValuePair.put("US", 30);
dataValuePair.put("China", 30);
StringBuilder data = new StringBuilder();
// build data object from label-value pair
data.append("'data':[");
for(Map.Entry pair:dataValuePair.entrySet())
{
data.append("{'label':'" + pair.getKey() + "','value':'" + pair.getValue() +"'},");
}
data.replace(data.length() - 1, data.length(),"]");
jsonData.append(data.toString());
jsonData.append("}");
%>Create your Chart
Let's create a Column 2D Chart using the jsp-fusioncharts wrapper showing "Countries with most Oil Reserves".
- The
index.jspfile will have thechart constructor,attributesand thedatasourcerequired to render the chart. The consolidated code is shown below:
<%@ page language="java" contentType="text/html; charset=ISO-8859-1" pageEncoding="ISO-8859-1"%>
<%@page import="java.util."_ %>
<%@page import=_"fusioncharts.FusionCharts"* %> <!DOCTYPE html PUBLIC "-//W3C//DTD HTML 4.01 Transitional//EN"
"http://www.w3.org/TR/html4/loose.dtd">
<html>
<head>
<meta http - equiv = "Content-Type" content = "text/html; charset=ISO-8859-1" >
<title> FusionCharts | My First Chart </title> <script type = "text/javascript"
src = "https://cdn.fusioncharts.com/fusioncharts/latest/fusioncharts.js"> </script> <script type = "text/javascript"
src = "https://cdn.fusioncharts.com/fusioncharts/latest/themes/fusioncharts.theme.fusion.js"> </script> <body>
<div id = "chart" > </div>
<%
// store chart config name-config value pair
Map<String, String> chartConfig = new HashMap<String, String>();
chartConfig.put("caption", "Countries With Most Oil Reserves [2017-18]");
chartConfig.put("subCaption", "In MMbbl = One Million barrels");
chartConfig.put("xAxisName", "Country");
chartConfig.put("yAxisName", "Reserves (MMbbl)");
chartConfig.put("numberSuffix", "k");
chartConfig.put("theme", "fusion");
//store label-value pair
Map<String, Integer> dataValuePair = new HashMap<String, Integer>();
dataValuePair.put("Venezuela", 290);
dataValuePair.put("Saudi", 260);
dataValuePair.put("Canada", 180);
dataValuePair.put("Iran", 140);
dataValuePair.put("Russia", 115);
dataValuePair.put("UAE", 100);
dataValuePair.put("US", 30);
dataValuePair.put("China", 30);
StringBuilder jsonData = new StringBuilder();
StringBuilder data = new StringBuilder();
// json data to use as chart data source
jsonData.append("{'chart':{");
for(Map.Entry conf:chartConfig.entrySet())
{
jsonData.append("'" + conf.getKey()+"':'"+conf.getValue() + "',");
}
jsonData.replace(jsonData.length() - 1, jsonData.length() ,"},");
// build data object from label-value pair
data.append("'data':[");
for(Map.Entry pair:dataValuePair.entrySet())
{
data.append("{'label':'" + pair.getKey() + "','value':'" + pair.getValue() +"'},");
}
data.replace(data.length() - 1, data.length(),"]");
jsonData.append(data.toString());
jsonData.append("}");
// Create chart instance
// charttype, chartID, width, height,containerid, data format, data
FusionCharts firstChart = new FusionCharts(
"column2d",
"first_chart",
"700",
"400",
"chart",
"json",
jsonData.toString()
);
%>
<%= firstChart.render() %> </body> </html>
<%@ page language="java" contentType="text/html; charset=ISO-8859-1" pageEncoding="ISO-8859-1"%>
<%@page import="java.util." %>
<%@page import="fusioncharts.FusionCharts" %> <!DOCTYPE html PUBLIC "-//W3C//DTD HTML 4.01 Transitional//EN"
"http://www.w3.org/TR/html4/loose.dtd">
<html>
<head>
<meta http - equiv = "Content-Type" content = "text/html; charset=ISO-8859-1" >
<title> FusionCharts | My First Chart </title> <script type = "text/javascript" src = "${pageContext.request.contextPath}/js/fusioncharts.js" > </script> <script type = "text/javascript" src = "${pageContext.request.contextPath}/js/themes/fusioncharts.theme.fusion.js" > </script> <body>
<div id = "chart" *> </div>
<%
// store chart config name-config value pair
Map<String, String> chartConfig = new HashMap<String, String>();
chartConfig.put("caption", "Countries With Most Oil Reserves [2017-18]");
chartConfig.put("subCaption", "In MMbbl = One Million barrels");
chartConfig.put("xAxisName", "Country");
chartConfig.put("yAxisName", "Reserves (MMbbl)");
chartConfig.put("numberSuffix", "k");
chartConfig.put("theme", "fusion");
//store label-value pair
Map<String, Integer> dataValuePair = new HashMap<String, Integer>();
dataValuePair.put("Venezuela", 290);
dataValuePair.put("Saudi", 260);
dataValuePair.put("Canada", 180);
dataValuePair.put("Iran", 140);
dataValuePair.put("Russia", 115);
dataValuePair.put("UAE", 100);
dataValuePair.put("US", 30);
dataValuePair.put("China", 30);
StringBuilder jsonData = new StringBuilder();
StringBuilder data = new StringBuilder();
// json data to use as chart data source
jsonData.append("{'chart':{");
for(Map.Entry conf:chartConfig.entrySet())
{
jsonData.append("'" + conf.getKey()+"':'"+conf.getValue() + "',");
}
jsonData.replace(jsonData.length() - 1, jsonData.length() ,"},");
// build data object from label-value pair
data.append("'data':[");
for(Map.Entry pair:dataValuePair.entrySet())
{
data.append("{'label':'" + pair.getKey() + "','value':'" + pair.getValue() +"'},");
}
data.replace(data.length() - 1, data.length(),"]");
jsonData.append(data.toString());
jsonData.append("}");
// Create chart instance
// charttype, chartID, width, height,containerid, data format, data
FusionCharts firstChart = new FusionCharts(
"column2d",
"first_chart",
"700",
"400",
"chart",
"json",
jsonData.toString()
);
%>
<%= firstChart.render() %> </body> </html>
Render the Chart
With the container for the chart created in index.jsp file, run this file on the local server, which by default runs on localhost:8080 .You should be able to see the chart as shown below.
If you are getting a JavaScript error on your page, check your browser console for the exact error and fix accordingly. If you're unable to solve it, click here to get in touch with our support team.
That's it! Your first chart using jsp-fusioncharts wrapper is ready.