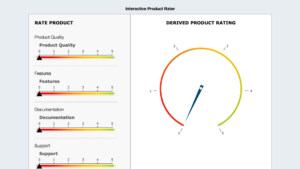
Sales Performance Dashboard
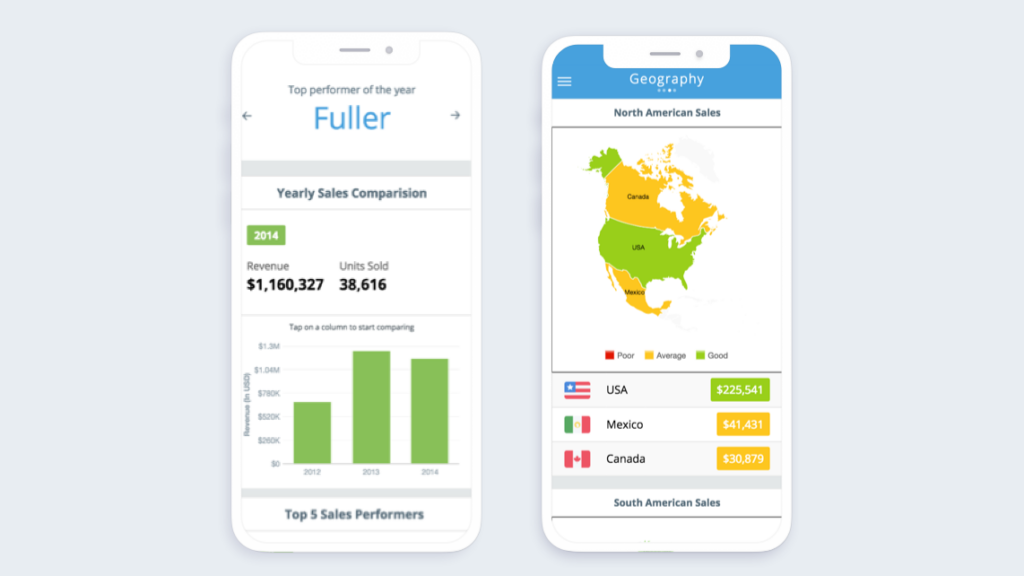
View sales performance on the go with our Mobile Sales Dashboard, using simple column charts for easy understanding and analysis. Quickly scan important numbers from the dashboard ‘Summary’, showcasing the #1 product, executive, city, and country. Capture all the data you need, and take it with you with our mobile-friendly interface.

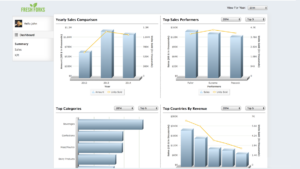
One dashboard, comprehensive data, and easy access - now view inventory, CSAT scores, region-wise performance and more from a single interface
Select the two columns you want to view/compare and the dashboard will automatically display YoY improvement or depreciation
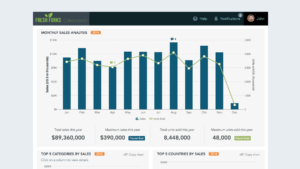
Analyze how a product is performing in terms of revenue generated and total units sold
Map your investments in inventory and workforces to real-world outcomes, and improve decision-making
How to get started with this dashboard
Project Files Setup
- Create a folder and extract the zip
- Navigate to the extracted folder
- Open 'index.html' in browser