Sankey Diagrams
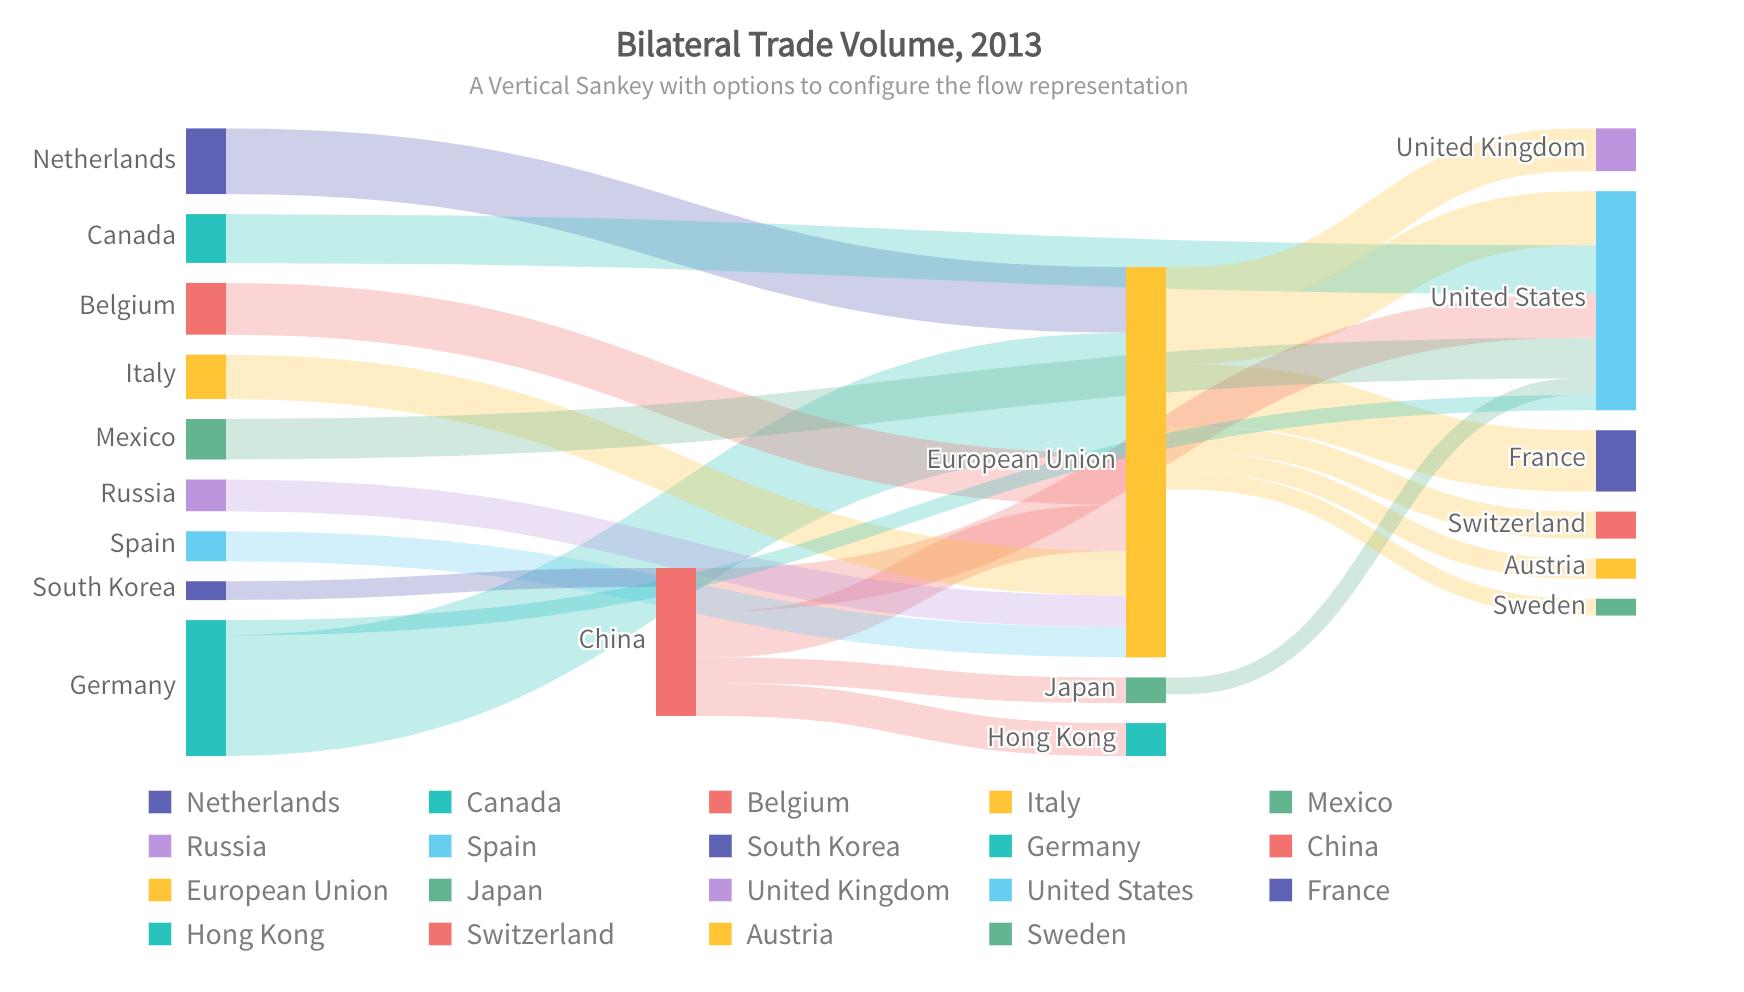
Sankey diagrams are a specific type of flow diagram typically used to visualize the flow of material, energy,and cost, shown proportionally to the flow of quantity. The flow happens between relatable entities (nodes)and is represented by colored links. It not only shows the flow values but also the information about thestructure and distribution of the defined systems.
Supported by different colors, flow quantities that have different dimensions are understood intuitively.Through these visualizations, data inconsistencies such as measurement errors and transmission errorscan be detected. Sankey diagrams draw the attention of the reader to the significant flows in the system.These can be the largest flows, the largest consumers, the main losses, among others.


