
If you’ve ever tried to make sense of the stock market, you’ve probably come across stock charts. They’re everywhere—from financial news to investment platforms. But have you ever wondered how to read or even create one yourself? Well, you’re in luck! Stockcharts are not just reserved for financial experts. In fact, with a little understanding and the right tools, anyone can master the art of visualizing financial data.
In this guide, we’ll break down what stock charts are, why they’re essential for investors, and how to create your own. By the end, you’ll be navigating stock charts like a pro. Ready to dive in?
Table of Contents
What Are Stockcharts?
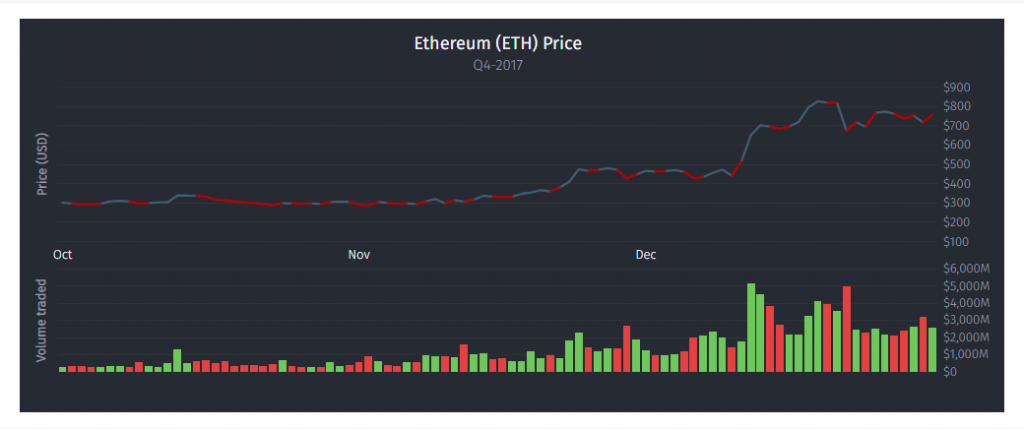
At its core, a stock chart is a graphical representation of a stock’s price over a period of time. But it’s more than just a simple line graph. Stock charts are rich in detail, offering insights into price trends, volume, and patterns that can help traders predict future price movements.
Stockcharts typically include:
- Price movement over time (daily, weekly, or even minute-by-minute)
- Volume of trades made during specific time intervals
- Technical indicators, such as moving averages and relative strength indexes (RSI)
- Candlestick patterns that show opening, closing, high, and low prices
These elements help investors determine when to buy, hold, or sell stocks based on historical data and predicted trends.
Why Are Stockcharts Important for Investors
The stock market can feel overwhelming with its fluctuating prices, cryptic tickers, and fast-moving trends. But stock charts help bring clarity to that chaos. Here’s why they’re so important:
- Visual representation of data: Instead of staring at endless columns of numbers, stock charts allow you to see the bigger picture at a glance.
- Spotting trends: Are prices going up or down? Is the market bullish or bearish? Stockcharts provide answers in real time.
- Timing your trades: Stockcharts offer insight into the best times to enter or exit trades by identifying key price levels and trends.
For long-term investors and day traders, stock charts are crucial tools that simplify complex data and make it actionable, playing a key role in documents like a Confidential Information Memorandum used in investment decisions.
Types of Stockcharts You Should Know
Now, let’s look at the different types of stock charts you’ll encounter.
1. Line Charts
The simplest of all, line charts represent the closing prices of a stock over a specific time period. They’re great for getting a general sense of the stock’s performance but don’t offer detailed insights into daily fluctuations.
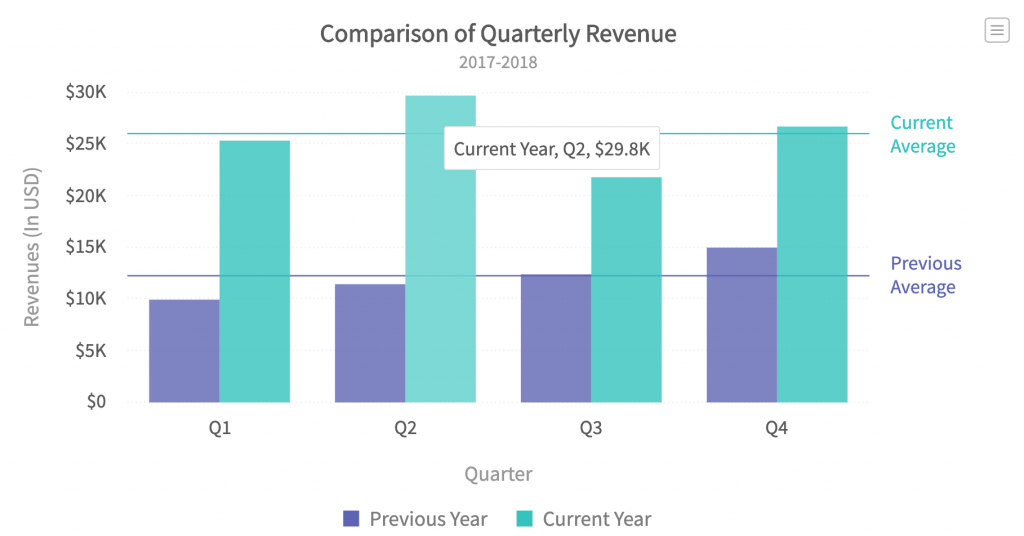
2. Bar Charts
Bar charts display the opening, closing, high, and low prices of a stock for each time interval. They’re often used by traders who want more detailed information about price movement.
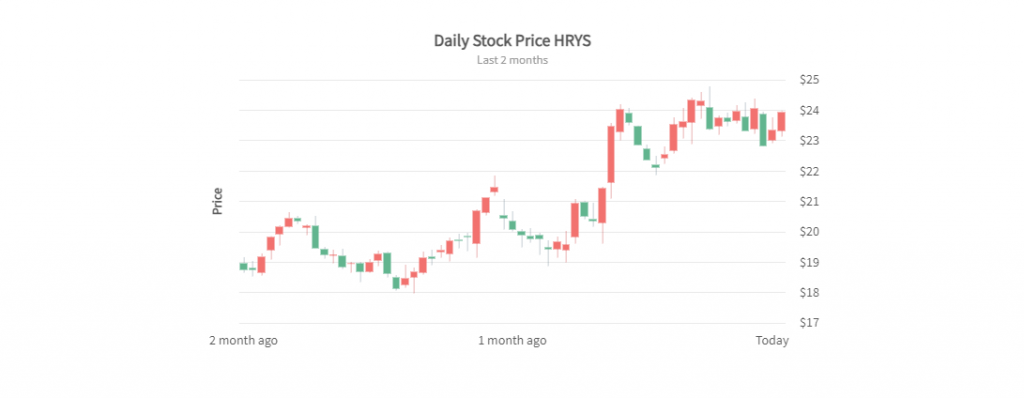
3. Candlestick Charts
Popular among traders, candlestick charts provide the same data as bar charts but in a more visual, intuitive format. Each ‘candle’ shows the stock’s opening, closing, high, and low prices over a specific period, and the color indicates whether the price closed higher (green) or lower (red) than it opened.
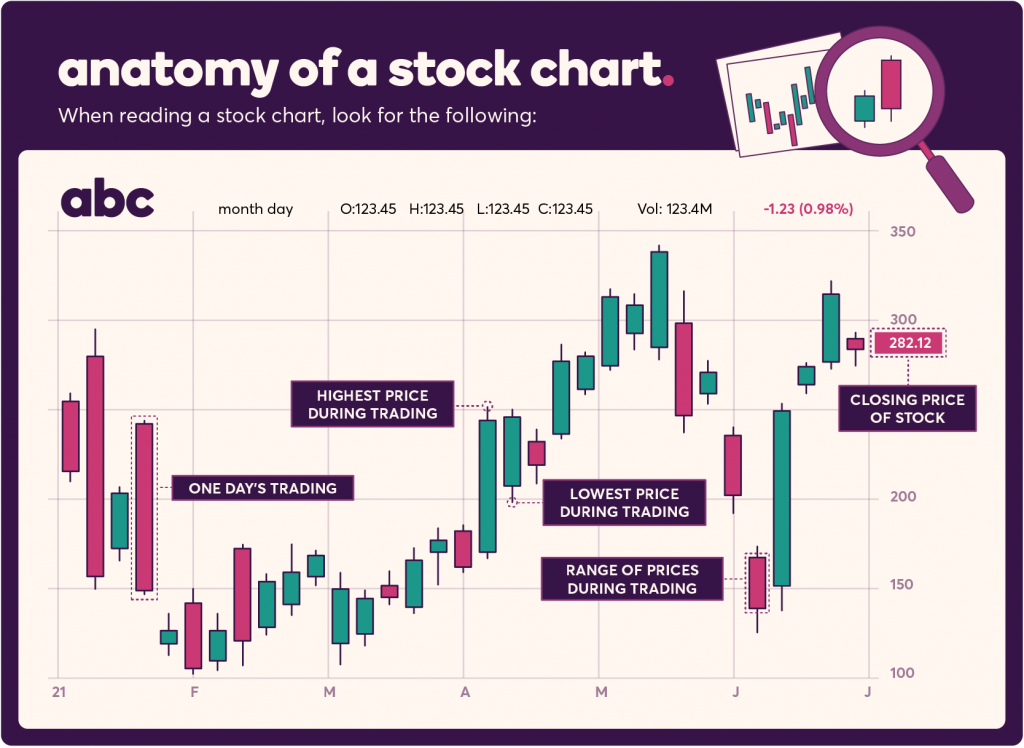
How to Read Stockcharts
Reading a stock chart can feel like deciphering a secret code, but it’s really quite simple once you get the hang of it. Here are the basics:
1. Identify the Time Frame
First, check the time frame the stockchart is showing. Are you looking at daily, weekly, or monthly data? Day traders may want minute-by-minute charts, while long-term investors often stick to daily or weekly views.
2. Analyze Price Movement
Look at the price line or candlesticks. Are they generally trending upwards or downwards? This will give you an idea of whether the stock has been gaining or losing value over the time period in question.
3. Spot Support and Resistance Levels
Support levels are prices where the stock has historically struggled to fall below, while resistance levels are prices where it struggles to rise above. These levels can help you time your trades.
4. Watch the Volume
Volume represents how many shares were traded during a specific period. If you see a big price move with high volume, it’s often more significant than a similar move with low volume.
How to Create a Stock Chart with FusionCharts
Let’s walk through the steps of creating a stockchart using FusionCharts. It’s simple, and you’ll have a powerful visual tool in no time!
- Choose Your Data: Decide which stock’s data you’ll be using—this can be from any public financial source.
- Set the Time Frame: Will you be looking at daily, weekly, or monthly data? FusionCharts allows flexibility here.
- Select the Chart Type: For stock charts, candlestick charts are typically the best choice, but bar or line charts work as well.
- Customize: Add volume data, moving averages, and other technical indicators to make your chart more informative.
- Embed and Share: Once your chart is ready, you can embed it on your website or share it directly with stakeholders or on social media.
FAQs about Stockcharts
How can I start learning to read stock charts?
Let’s walk through the steps of creating a stockchart using FusionCharts. It’s simple, and you’ll have a powerful visual tool in no time!
Are stock charts only useful for day traders?
Not at all! Stock charts are helpful for any type of investor, whether you’re trading frequently or holding for the long term.
Can I use stock charts for other investments besides stocks?
Absolutely. You can use stock charts to analyze other assets, like commodities, ETFs, and cryptocurrencies.
Conclusion
Stock charts are invaluable tools that bring clarity to the sometimes confusing world of financial data. Whether you’re a seasoned trader or just starting, learning how to read and create stock charts can give you a significant advantage. With the right tools, like FusionCharts, you can transform complex stock data into easy-to-read visuals that empower better investment decisions.
So, what are you waiting for? Dive into stock charts today and start making more informed trades!
h4{
color:#9900ff;
font-size:19px;
}
h2{
color:#3c78d8
}