Immigration to the US
Data Story by FusionCharts
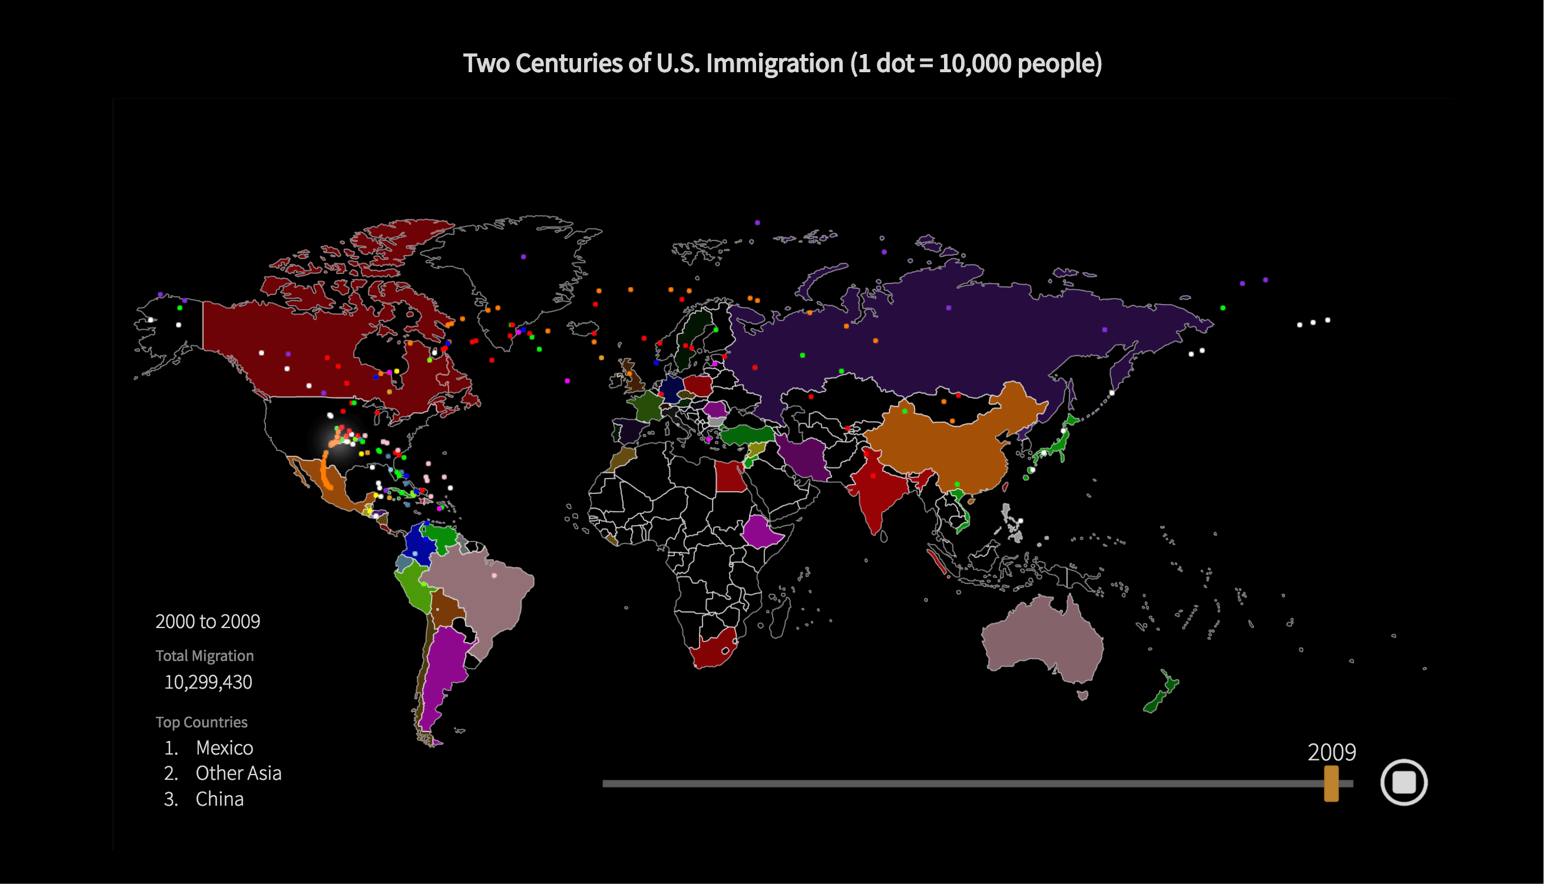
This interactive map visualizes the lawful migration of people to the US over the last two centuries. It shows that most of the immigration took place from Western Europe in the early 1800s, Eastern Europe in the late 1800s, and from the Americas in the early 1900s. The last few decades have seen major migration from the Asian countries. Each wave of migration coming from a particular country has a story behind it – usually escaping persecution (like Jews escaping Russia after the May Laws was enacted or the Cuban Revolution) or major economic troubles (like the Irish Potato Famine or the collapse of southern Italy after the Italian Unification).
This sample dashboard is built using FusionCharts Suite XT, which needs a license for commercial use.
Want to use this Data Story in your projects?
We can plug in your data into our data story templates, or customize the template for your needs, or even build a completely new one. We would love to talk to you!