Music Player with Graphic Equalizer
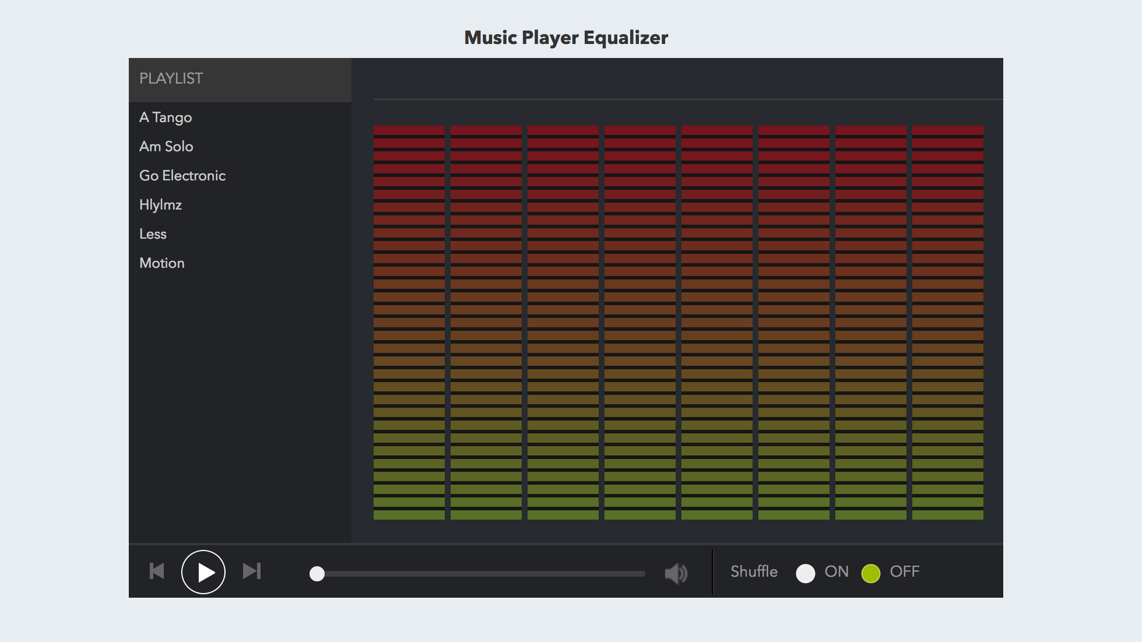
Want graphic equalizer like visualizations to go with your favorite music tracks? The online music player application from FusionCharts is just the thing you need. Visualize music tracks as LED gauges, pause/play/rewind anytime you want, and even shuffle tracks in a playlist. Integrate it with your existing audio apps to add visualization to audio tracks, and view playlists as you play music.
This sample dashboard is built using FusionCharts Suite XT, which needs a license for commercial use.
Key features
- The audio data from music tracks is split into 16 buckets using the Audio API of HTML5, and is displayed using 8 LED gauges of FusionCharts.
- The gauges are fed with data denoting the signal strength of each bucket, with color range values between 0-255. The data is fed into all the 8 LED gauges at the rate of 21 times/second.
- Use the volume controller to increase or decrease the sound volume.
- Use the controls to play, pause, fast forward, or rewind any track.
- Turn on Shuffle to randomize the order in which tracks are played, when you use a playlist.
FusionCharts products used
Technologies used
How to get started with this dashboard
Project Files Setup
- Create a folder and extract the zip
- Navigate to the extracted folder
- Open 'index.html' in browser
Similar Dashboards

Web Series Dashboard
The performance of web series’ in terms of subscribers, revenue, IMDb rating and Emmy awards, across different platforms like Netflix, Amazo...
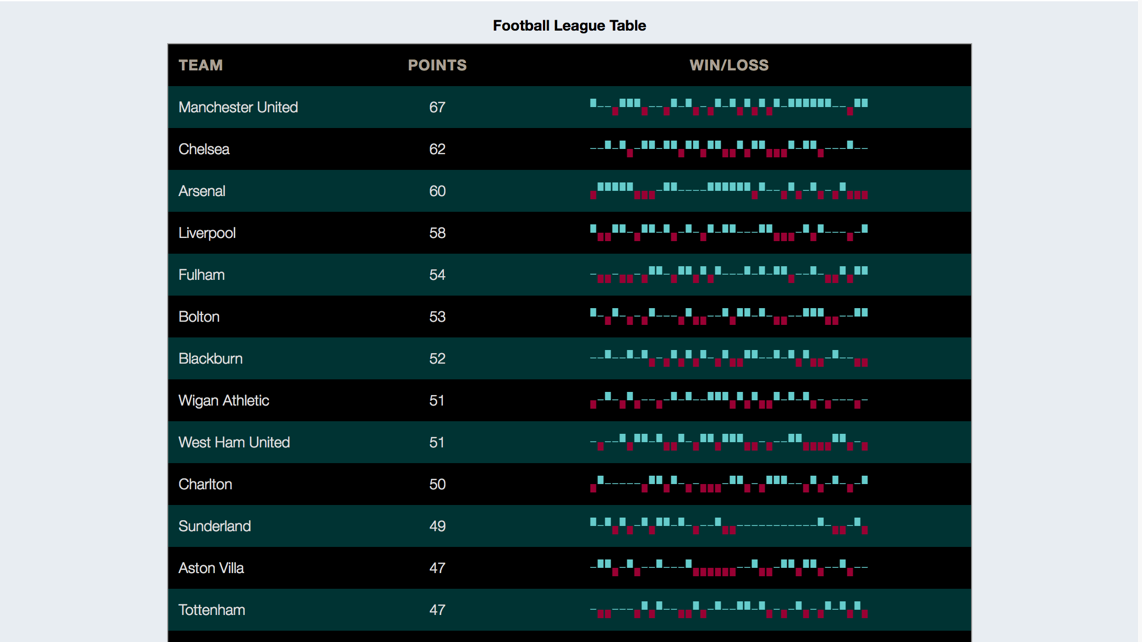
Football League Dashboard
A simple dashboard with one, single purpose – keep you updated on your favorite teams’ performance. Our Football League Dashboard maps the w...
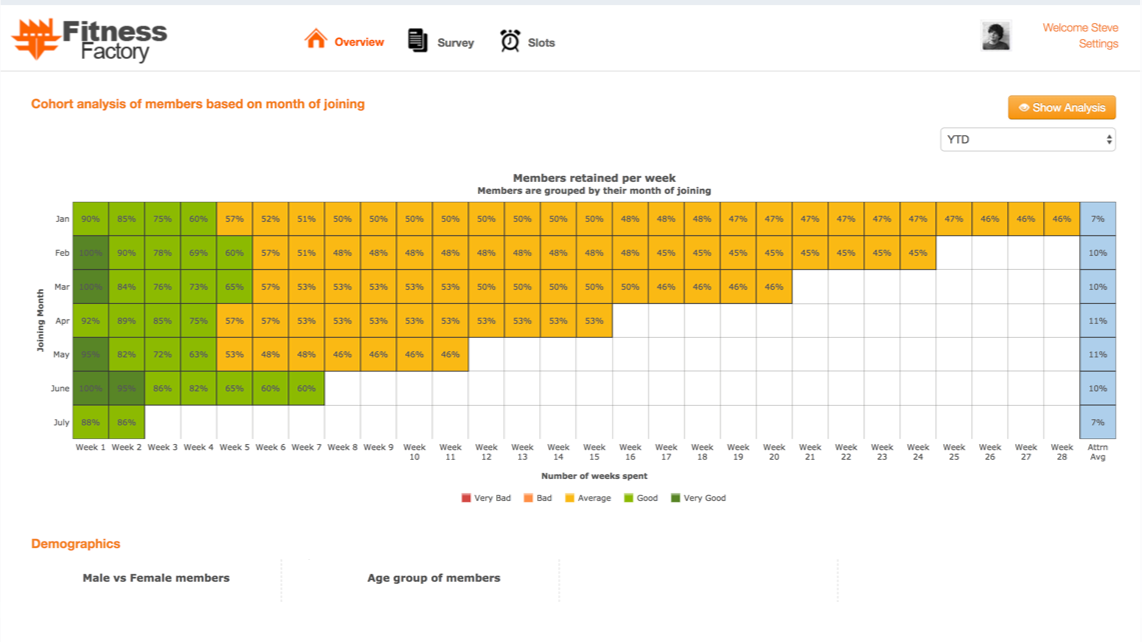
Membership Monitoring Dashboard
Analyze attrition & retention rates at your business, and understand member demographics, preferred visit times, campaign impacts, and more.