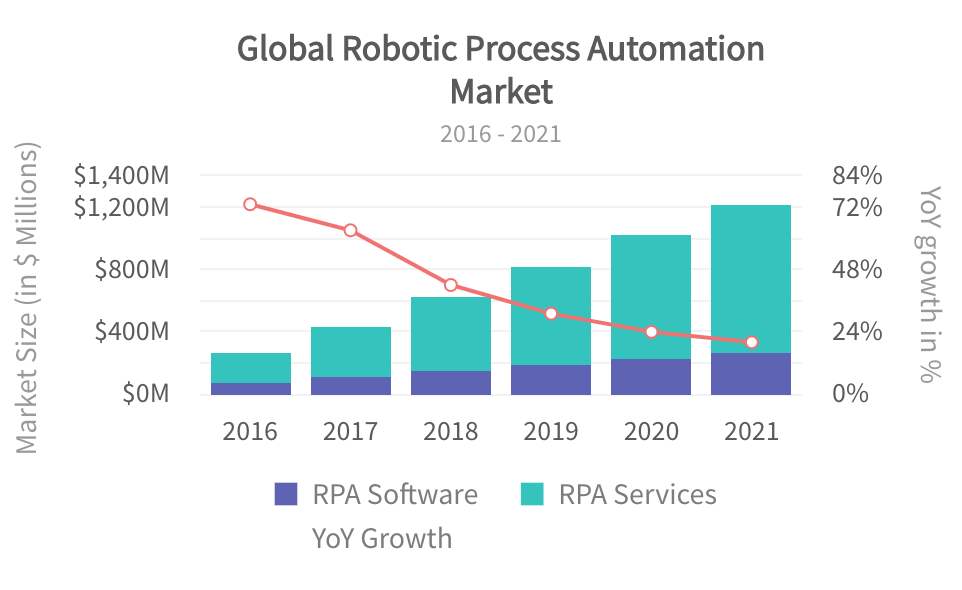
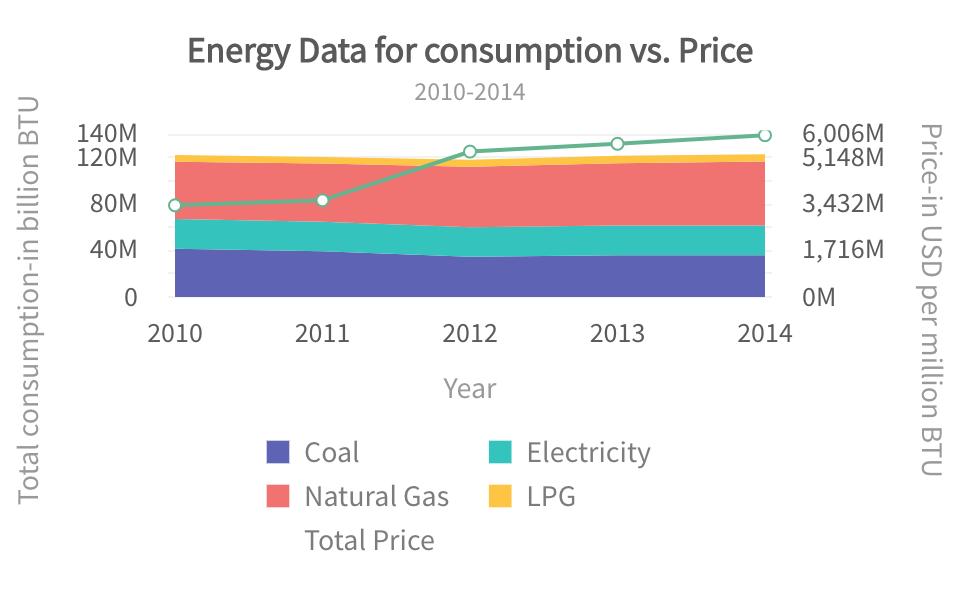
Combination Charts
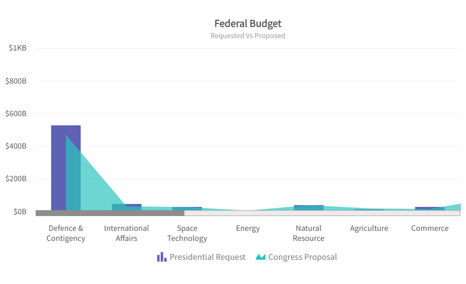
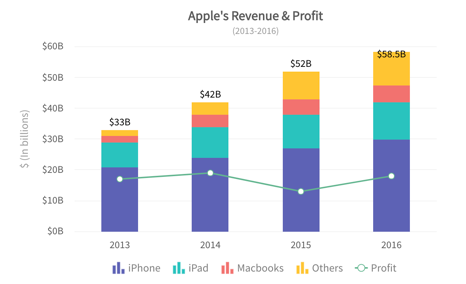
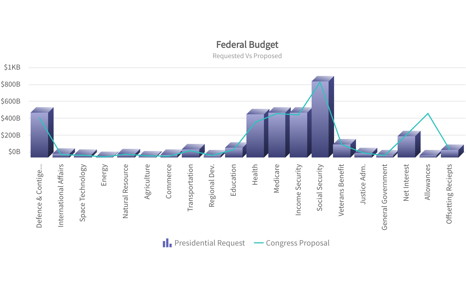
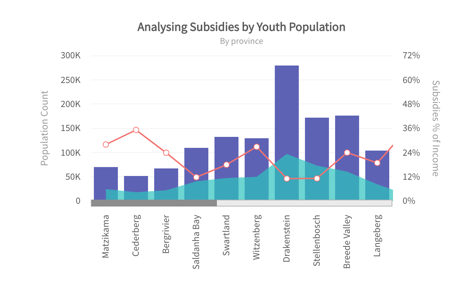
Combination Charts are used to plot data that belongs to multiple categories.Working similarly to the multi-series charts, Combination charts add another layer of insights by allowing not only multiple data categories but also multiple reprsentations. This allows displaying a lot of related information in a single view