Column in 3D in JavaScript Part of FusionCharts XT
Related charts and Widgets
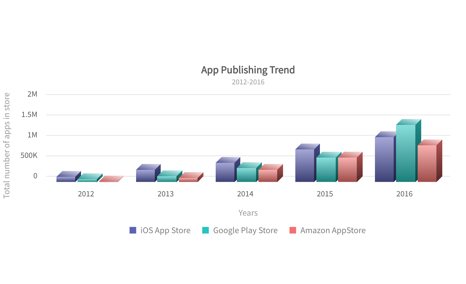
Grouped column in 3D with multiple series
Analyze and compare grouped sub-categories in 3D
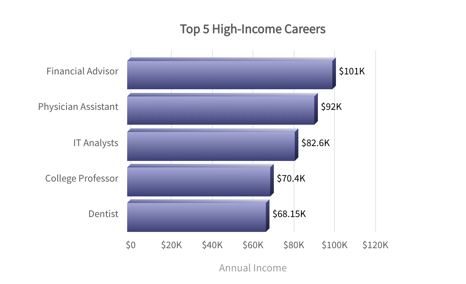
Bar in 3D
Visualize catagorical data in 3D for comparisons and analysis
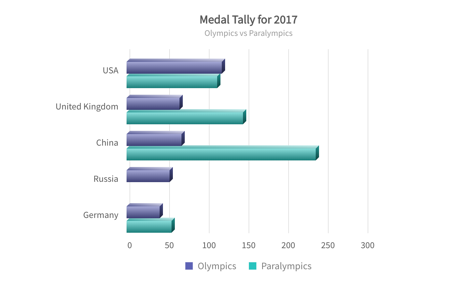
Grouped bar in 3D with multiple series
Analyze and compare grouped sub-categories in 3D
Build 100+ charts and 2000+ maps
Go beyond column charts and pie charts with our 100+ charts made for any kind of data. From area to donut and marimekko to radar, we’ve got all your charting needs covered. Don’t just stop at charts, with 2000+ maps, gauges and more, your dashboards and reports will become more meaningful and insightful.

Chart Gallery
Explore 100+ charts for your React application

Time Series Gallery
Explore how to plot millions of data on a time-series chart in React

Maps Gallery
Render 2000+ Maps for your React project


Explore dashboard with column chart
We have built over 20+ dashboards for various industries and use-cases. The best part of these dashboards? They are open source and completely free to use! Just download them and explore how you can use React Charts for FusionCharts in the real-world.
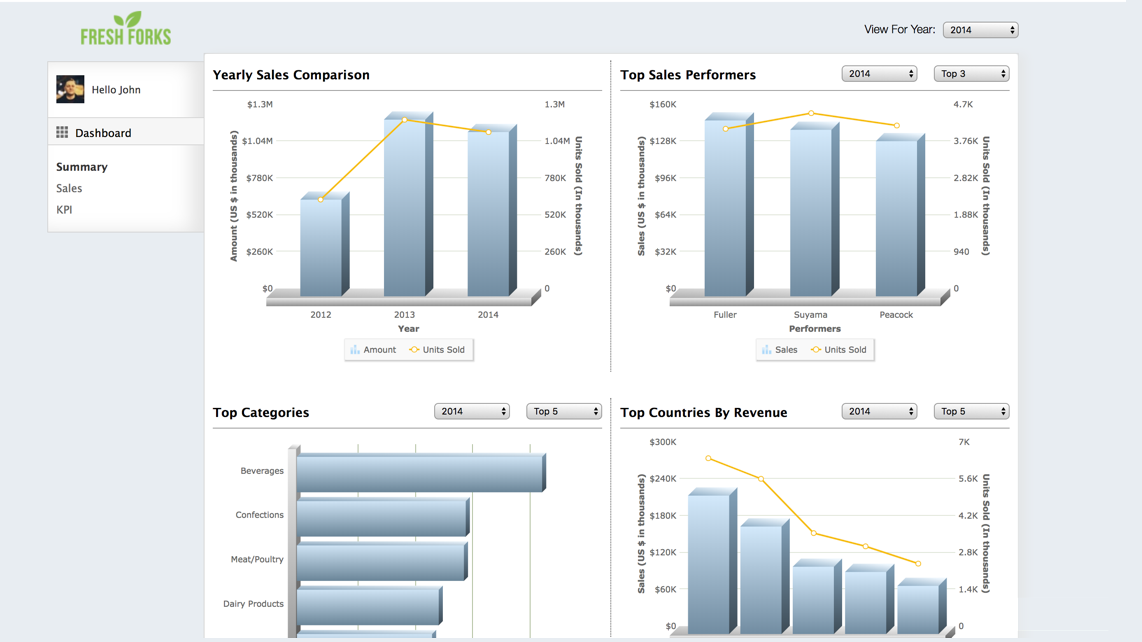
Sales Performance Tracker (3D)
Track sales figures over several years, and monitor sales team performance from a single integrated interface, with our Management Dashboard (3D).
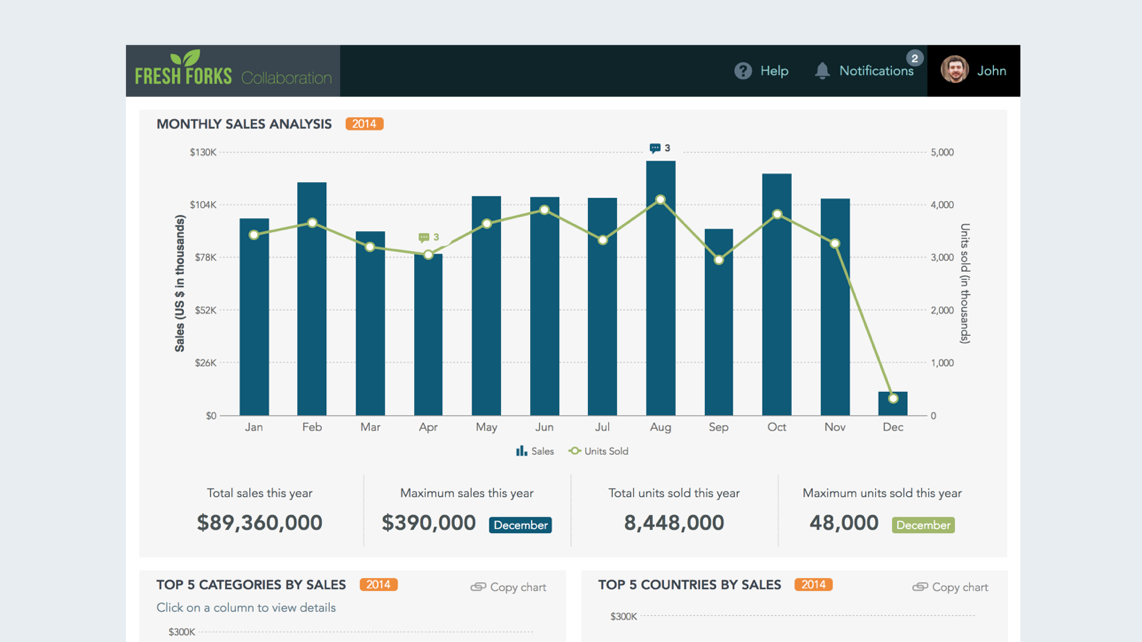
Sales & Collaboration Dashboard
Know how your business is doing, share your thoughts, instructions, or a pat on the back with colleagues, and secure data sharing with profile-based access.
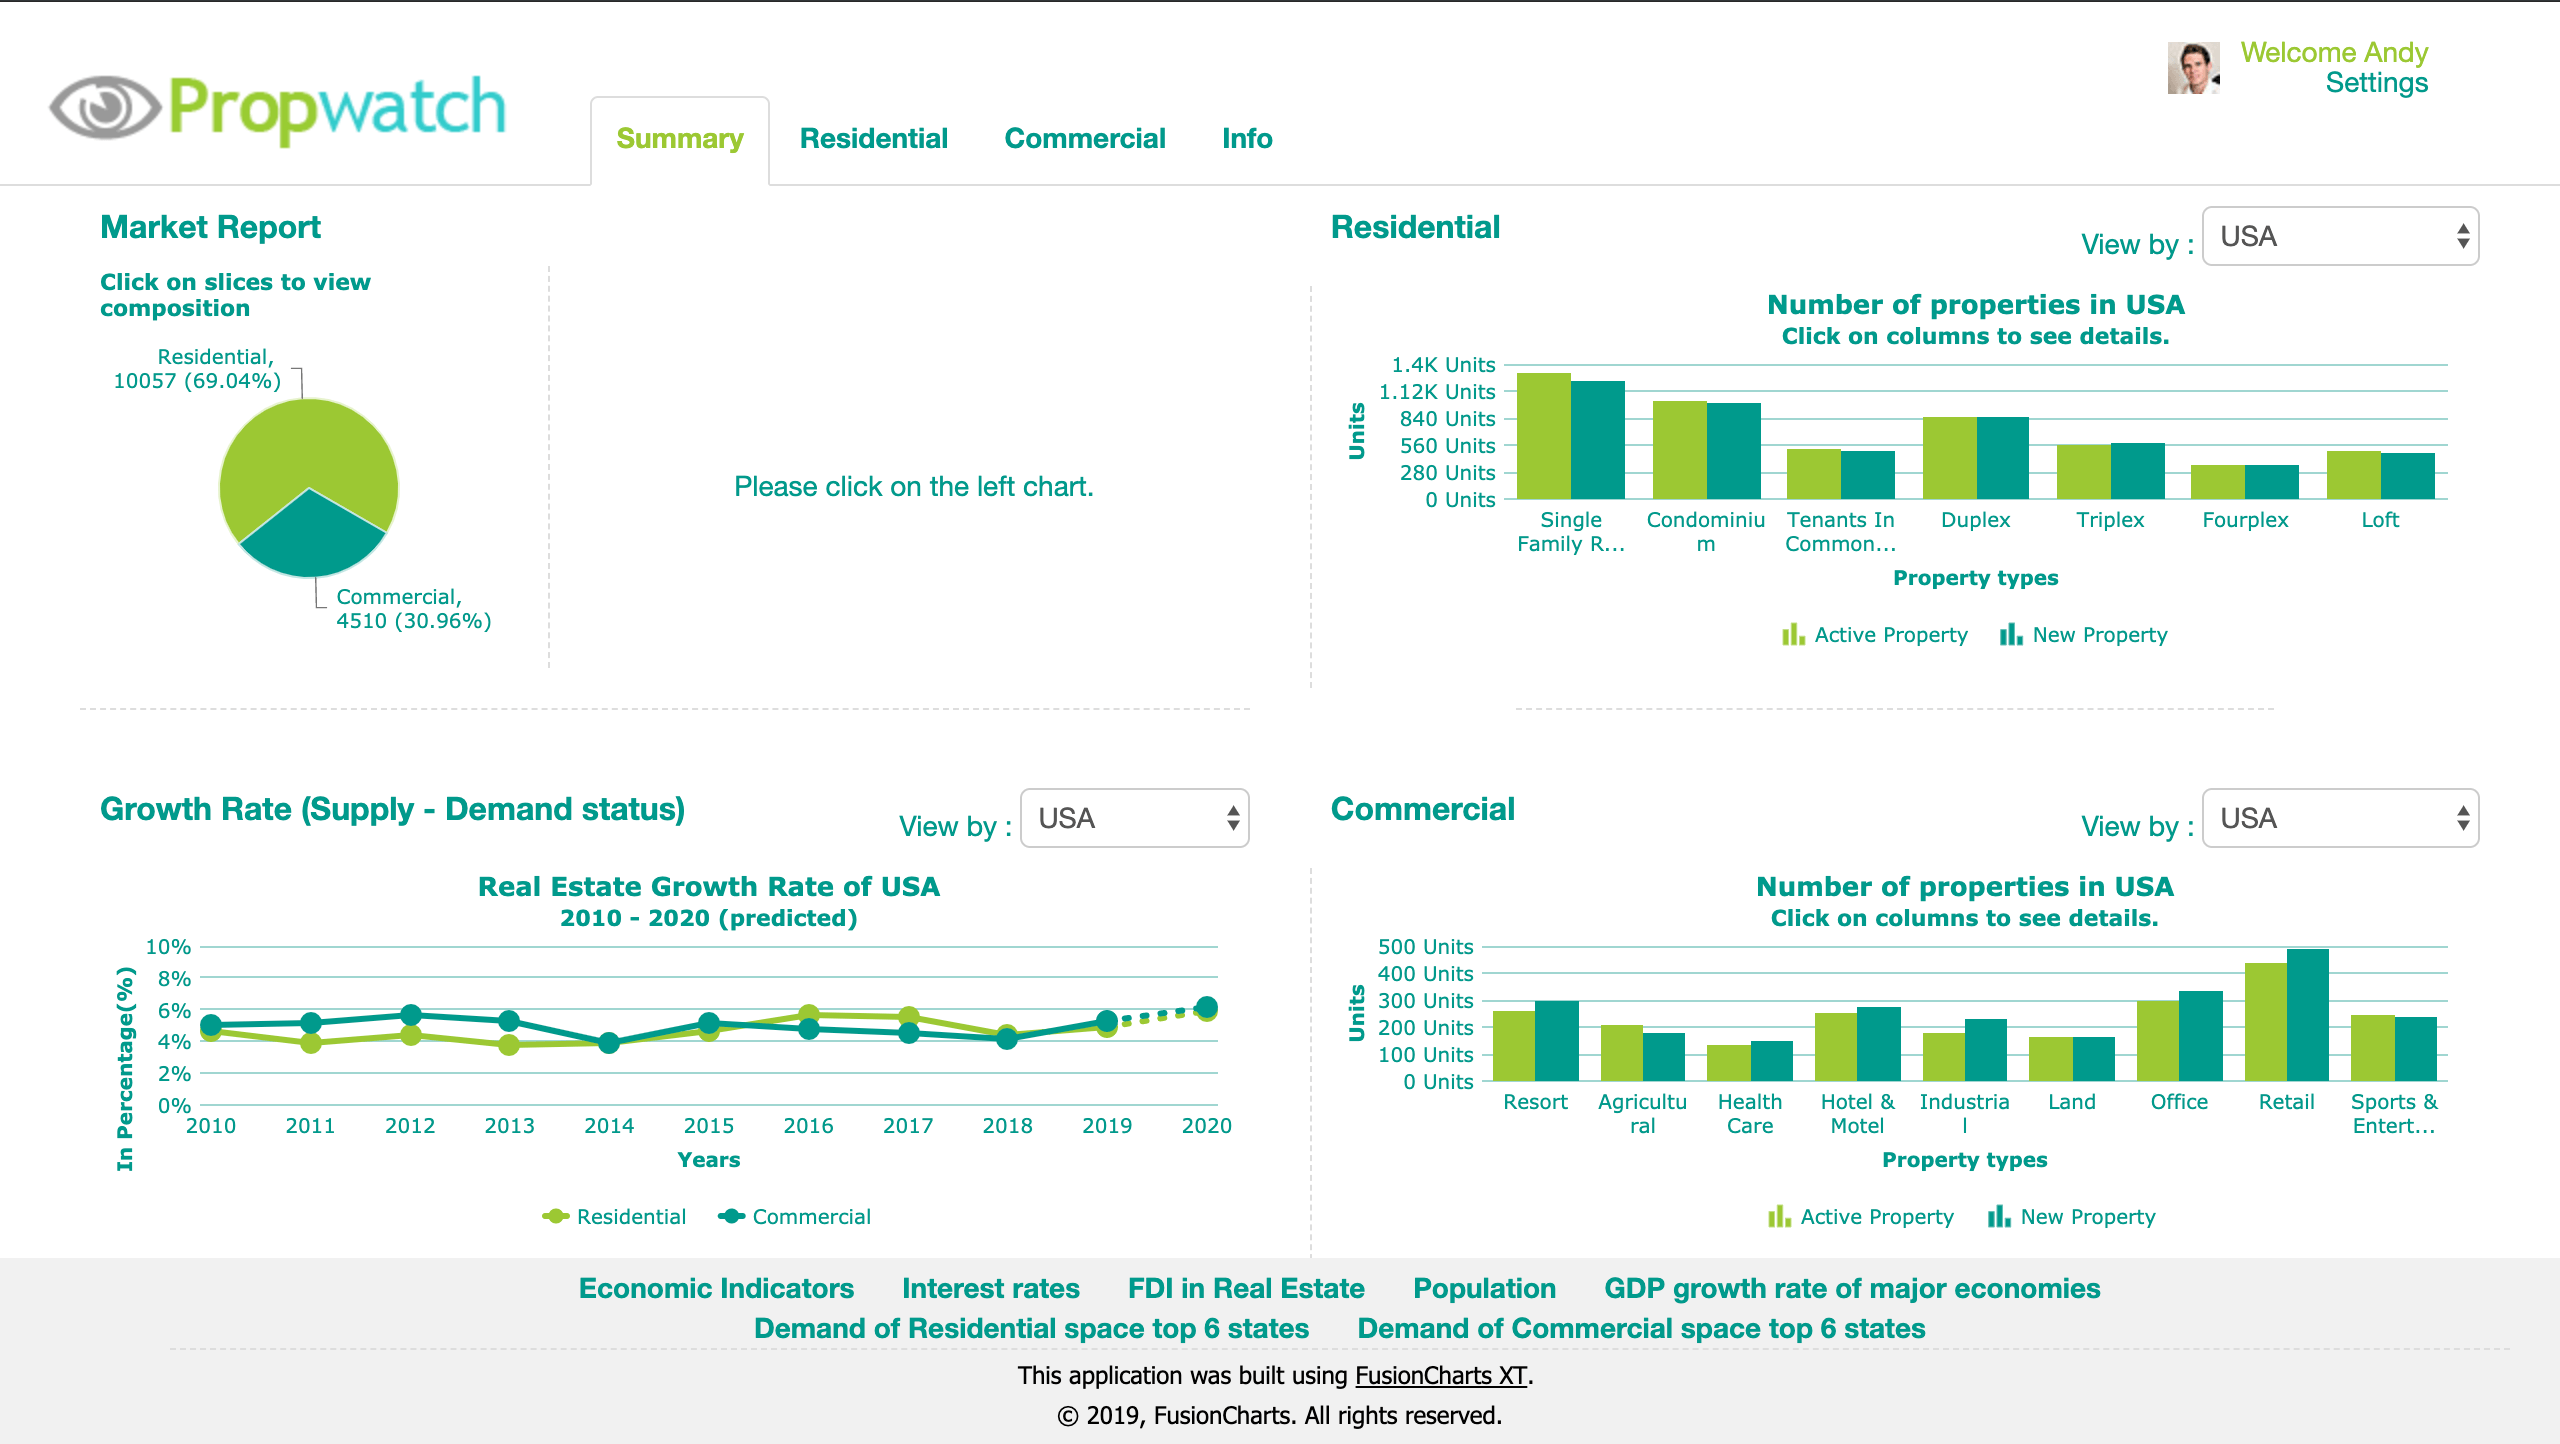
Realty Information Dashboard
View exact metrics on property prices & realty market performance in different segments and help your customers invest wisely.
